
-
 Admin123 :
Admin - Sapphire Capitals
Admin123 :
Admin - Sapphire Capitals -
 Date :
2023-07-02
Date :
2023-07-02
Stock In Focus - Week 27 (2023) – TAIWAN – VOLUME SPIKE TRADING STRATEGY
The week beginning Monday, the 3rd July is Week 27 as per ISO numbering convention of the weeks of a year.
Country in focus:
This week we look at the Stocks from Taiwan in TWII: TAIWAN WEIGHTED index.
Stock/ETF in focus:
Specific Stock in focus is Emerging Display Technologies Corp. (Ticker: 3038). The Stock is listed in the Taiwan Stock Exchange (TSE), the trading currency is Taiwanese Dollars or TWD.
Trade Direction:
BULLISH, Volume Spike study since beginning of 2020 reveal 73.7% probability of success in a BUY (LONG) trade. Please note that probability is not certainty, so always trade with complete discipline of risk management and that there is a plan if trade does not playout as anticipated.
Most Recent Event:
Most recent Volume spike event was on Tuesday, the 27th June 2023. Usually, the trade is opened on the day after the Volume Spike event, or Wednesday, the 28th June. But, since this blog is being written over the weekend, the potential trade opening is the next market open day on Monday, the 3rd July.
Overview:
Emerging Display Technologies Corp. produces and sells capacitive touch panels and liquid crystal displays (LCD) in Taiwan, Europe, the United States, and internationally. Emerging Display Technologies Corp. was founded in 1983 and is headquartered in Kaohsiung, Taiwan.
The company offers thin-film transistor (TFT), super-twisted nematic (STN) character and graphic, TFT with capacitive touch, STN display, and FSTN display technologies using various methods of driver electronics on various modules, such as chip on glass, chip on board, chip on flex, tape automated bonding, and flexible print circuit board. It also provides smart embedded modules that offers components to control the display and touchscreen, as well as various interfaces. The company used its products in industrial equipment, smart home control devices, healthcare equipment, handheld devices, and information appliance products.
(Courtesy: Yahoo Finance)
Sector and Industry Details:
Sector(s): Technology
Industry: Electronic Components
Full Time Employees: 1,390
(Courtesy: Yahoo Finance)
Fundamentals:
52 Week Range 18.60 - 44.80
Avg. Volume 7,666,443
Market Cap 6.227B
Beta (5Y Monthly) 0.28
PE Ratio (TTM) 14.55
EPS (TTM) 2.88
Ex-Dividend Date Jul 10, 2023
(Courtesy: Yahoo Finance)
Current trading price:
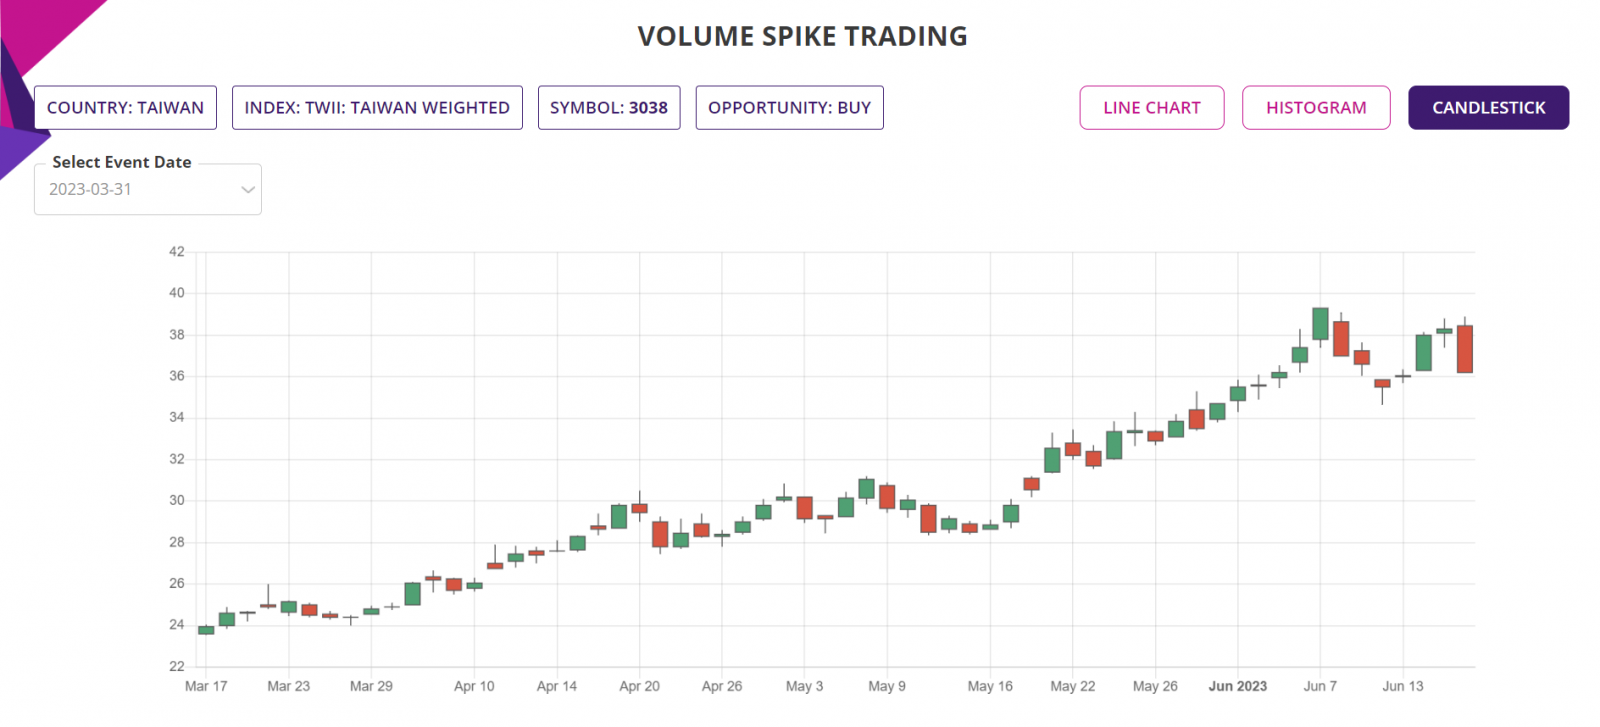
As of Tuesday, the 27th June 2023, or the day the latest Volume Spike event took place, the stock closed at 39.75. The size of the Volume Spike was 5.0X of the average volume. There was one more Volume spike was on 24th of May 2023 with a spike size of 3.29X. This is very significant and indicative of buying frenzy in the market.
VOLUME SPIKE EVENT:
The Stock was BULLISH 73.7% of the time following Volume Spike events since the beginning of 2020, average spike size being minimum of 3X. Here is the key Volume Spike event performance of the Stock:
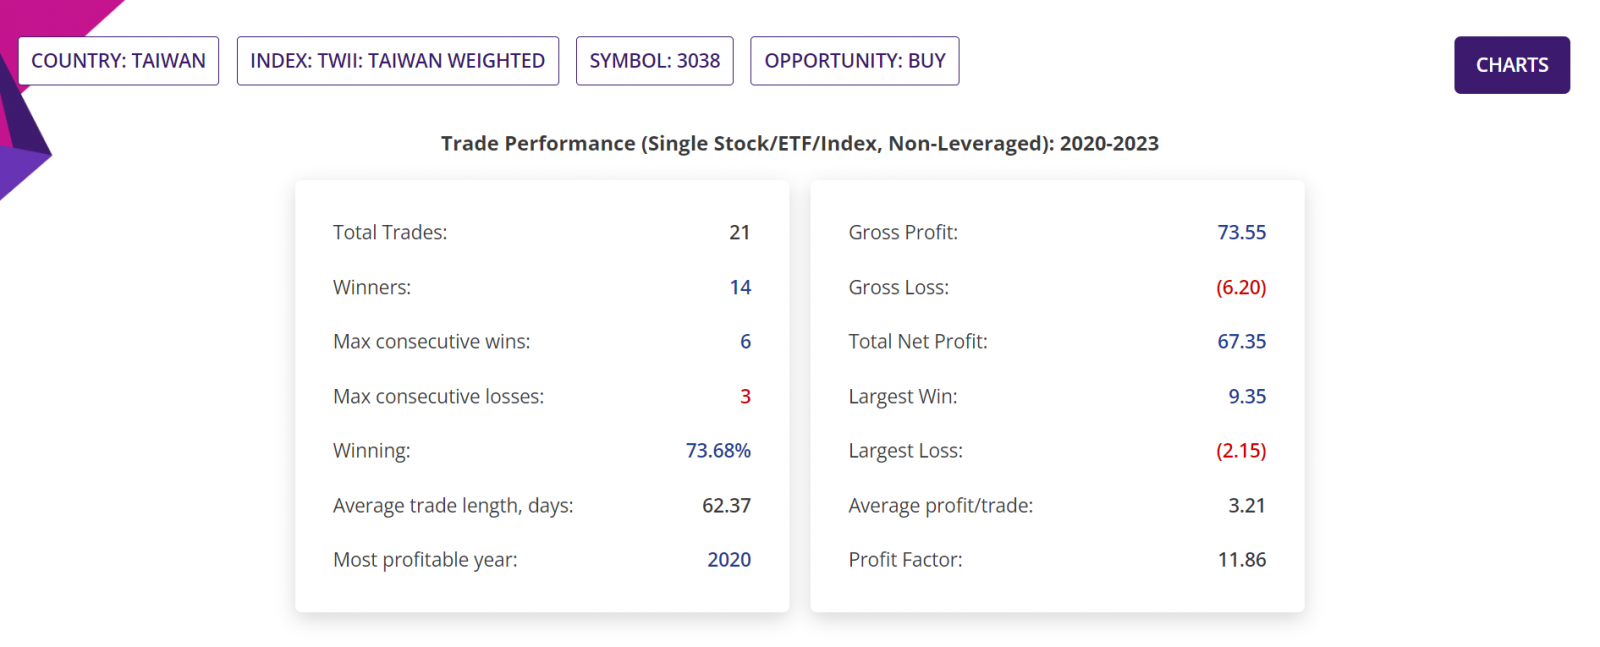
Summary report: Since beginning of 2020, there were 21 Volume Spike events, out of which the latest event of 27th June is yet to be traded, that is the current BULLISH trading opportunity being discussed in this blogpost. There were also one more Volume spike events as mentioned earlier which are still in open trades. This leaves 19 completed trades using Volume Spike trading strategy, of which there were 14 winners (and hence 73.7% confidence or Probability) with average move up (AMU) of whopping 20.88% and average move down (AMD) of 5.93% for an average holding time (ADH) of about 47 days.
Historical RRR in those completed trades was a whopping 2.6:1. Please note that RRR shown here is a worst-case scenario, as many trades could be closed sooner with higher profit compared to trades closed at the end of 9-week period.

Detailed Report, Trade Performance: If 1,000 stocks were bought following those Volume Spike events, then a trader would have had a Gross Profit of 73,550, Gross Loss of 6,200, making a Total Net Profit of 67,350. In those closed trades, the Largest Win was 9,350, the Largest Loss is 2,150, the Average profit/trade being 3,210. All figures above are in TWD.
The Profit Factor (which is quotient of Gross Profit and Gross Loss) in those trades was a whopping 11.86.
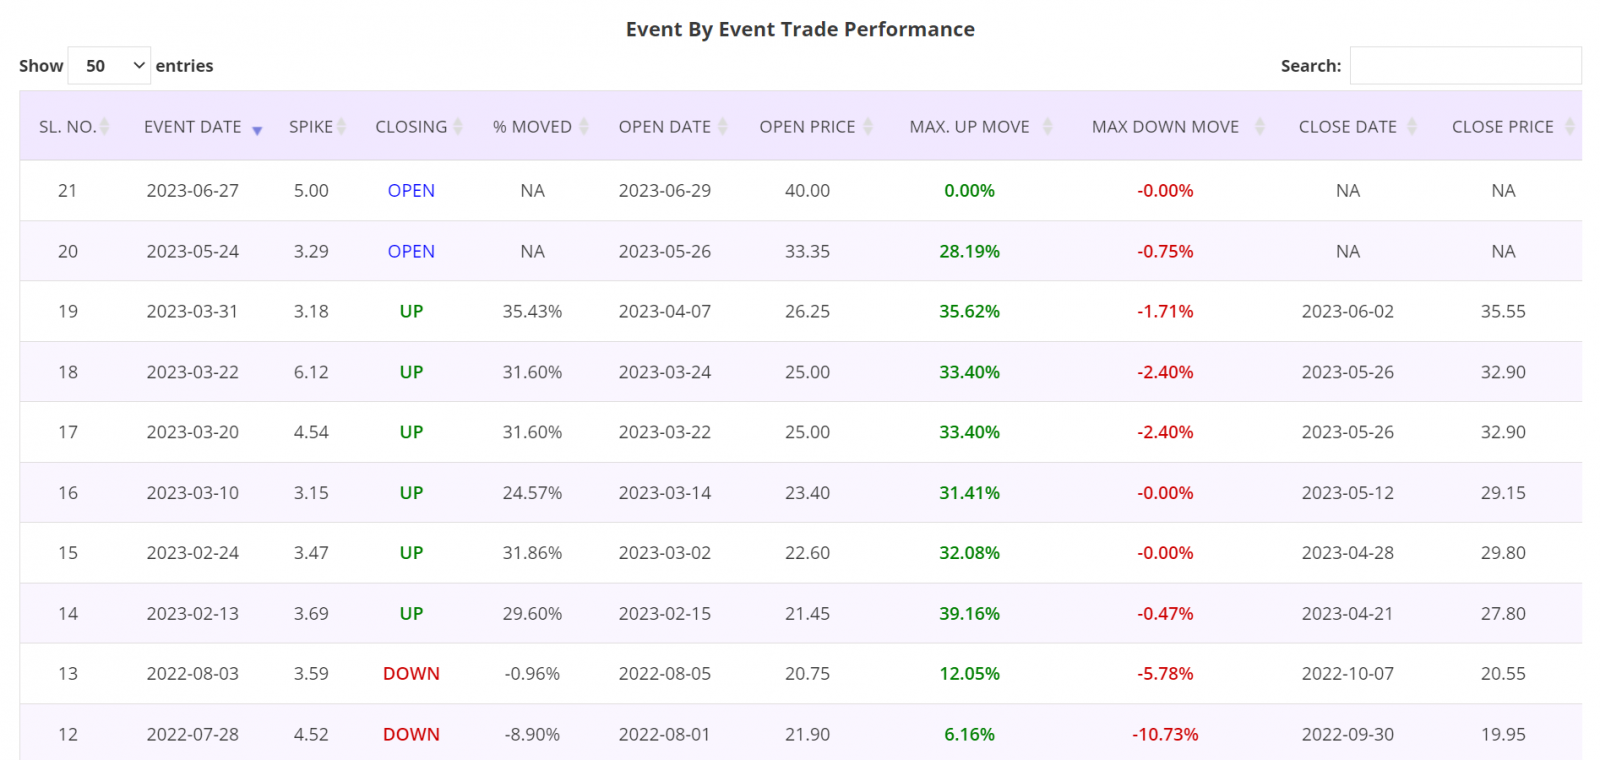
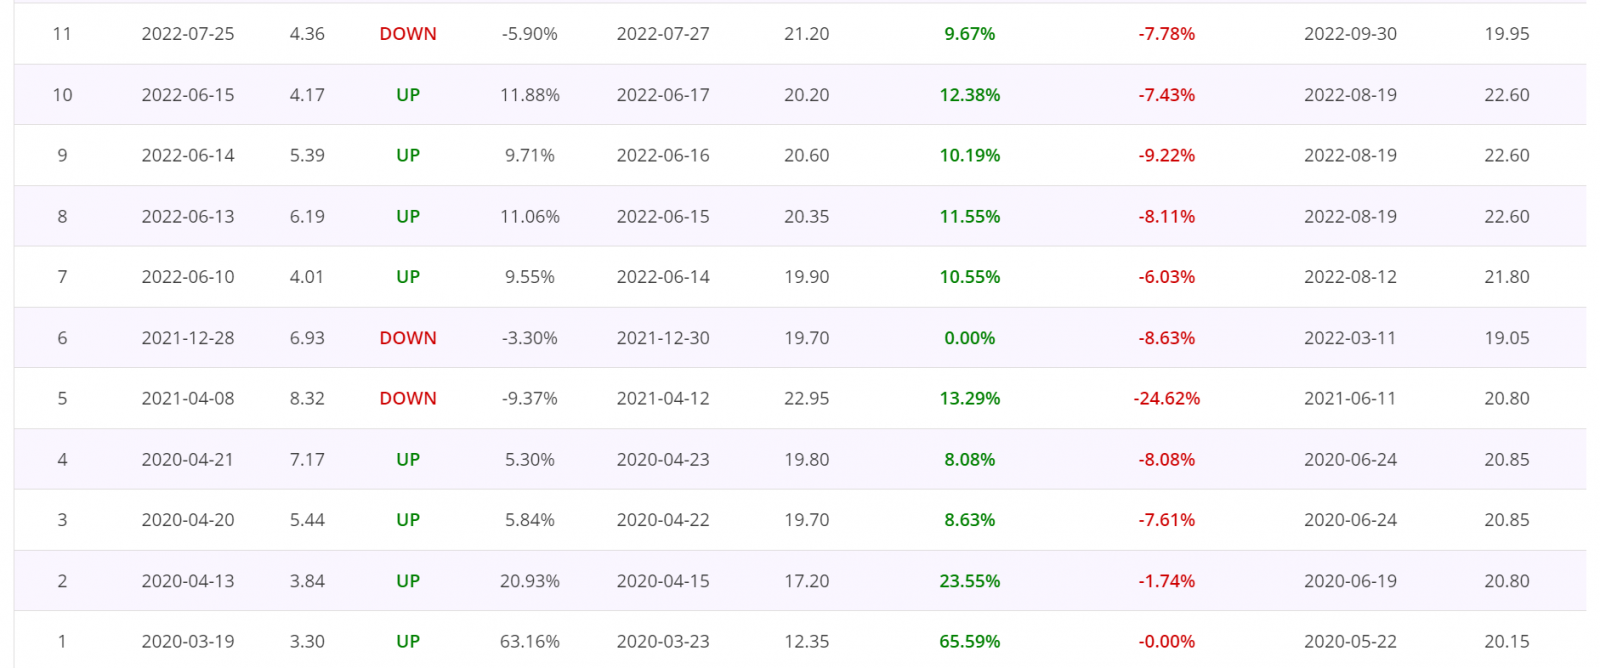
Detailed Report, Trade by Trade Performance: Results of each trade taken following the Volume Spike events since the beginning of 2020 are as shown in the table below. These tables are from the Detailed report of the Volume Spike trading app.
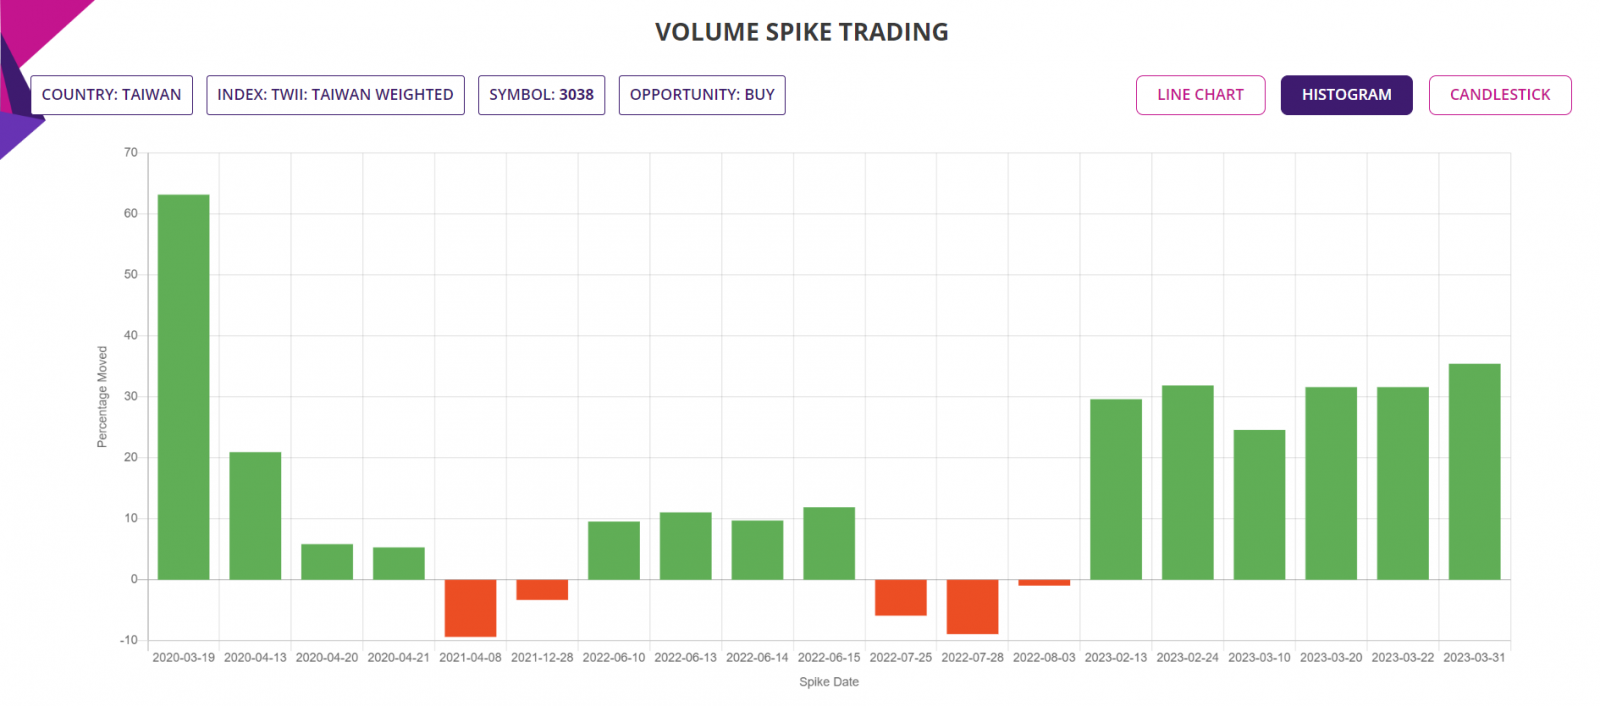
Histogram Chart: The chart below shows the percentage moves of the underlying Stock of Interest following each Volume Spike event for the period of analysis mentioned earlier, for a quick visual clue of the trade-by-trade performance.
Candlestick Chart: The candlestick chart of the underlying Stock/ETF’s latest performance is as shown below. In the web-based Volume Spike trading app, the chart is available for all the Volume Spike events since the year in the “Data since” in the input filter page.
Trade Structure:
This week’s Stock of interest is for the purpose of illustration only and hence no trade structure is included in this blog.
Further Information about trading applications:
Please visit the following URL for more information on various trading applications from Sapphire Capitals which are designed to deliver high probability trading opportunities for swing trading as well as for intraday trading:
https://www.sapphirecapitals.com/pages/swing-trading-stock-seasonality-strategy/
https://www.sapphirecapitals.com/pages/swing-trading-stock-price-action-strategy/
https://www.sapphirecapitals.com/pages/swing-trading-volume-spike-stock-trading-strategy/
https://www.sapphirecapitals.com/pages/day-trading-intraday-seasonality-trading/
Disclaimer:
Sapphire Private Assets (ABN: 34 613 892 023, trading as Sapphire Capitals) is not a broker or a financial adviser but an education and research organization; we provide training and tools for traders and DIY fund managers for trading in global financial markets. The contents of the blog have been produced by using technical analysis and trading applications developed by Sapphire Capitals for the Stock and ETF traded worldwide. The contents of this blog are intended for education and research purposes only and is not a recommendation or solicitation to invest in any Stock or ETF.
For more details, please visit http://www.sapphirecapitals.com/Disclaimer.


