What is price action trading and why traders world over use it?
Price action, in simple terms, means the movement of price against time and Price action trading means that trading decisions made only on the price movements of the underlying Stock or ETF. This is based on the premise that only true source of information comes from the movement of the underlying’s price itself. This assumption comes from 1973 Noble prize winner Professor Eugene Fama’s Efficient Market Hypothesis (EMH) which postulates that stock always trade at its fair value and all the public information about the Stock is already factored in its price.
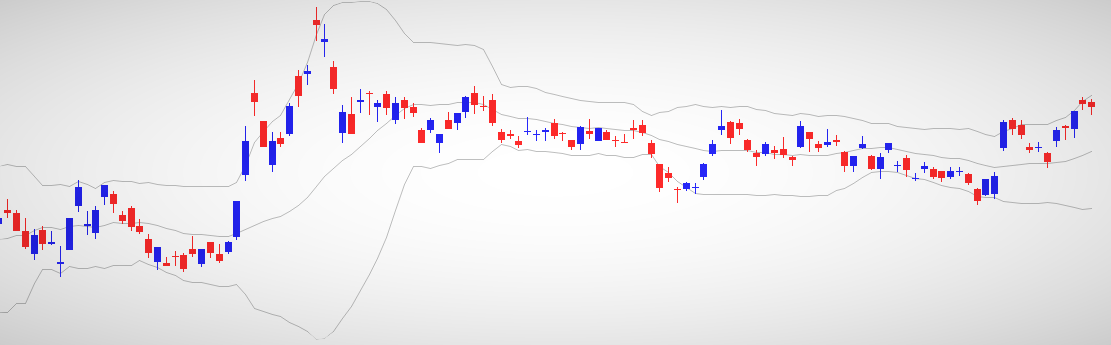
There are many different strategies traders use for the study of price action, one of those being the study of the momentum or trend or volume or volatility or various combinations of these. Traders use a range of indicators to make sense of the current state of the price action and make an assessment of possible future movement of the underlying Stock or ETF.
Combining price action study for key technical criteria such as momentum, trend and volume with statistical analysis of past price action patterns can produce spectacular performance where the trader can not only find out how many such price action patterns had occurred in past but also learn how did those patterns perform in terms of success rate and all other parameters related to the price movement that followed. Knowing the past performance of the price action patterns and statistical parameters around it provides the trader confidence to make their trading decisions as there is a solid foundation behind it in form of expectancy and not just a subjective assessment of the current price action.
How does Price Action trading app work?
The algorithm behind our Price Action trading app has been developed with years of research and uses a proprietary combination of indicators and technical conditions to find the recent price action events and past history of events, their success rate for the number of years the chosen by the user. So when a bullish or bearish price action pattern with positive expectancy is identified by the app, the trader can make the trading decisions based on the probability of recurrence of the price action pattern and past reward-risk ratio with additional information such as likely high and low levels and the time taken to reach those levels etc.
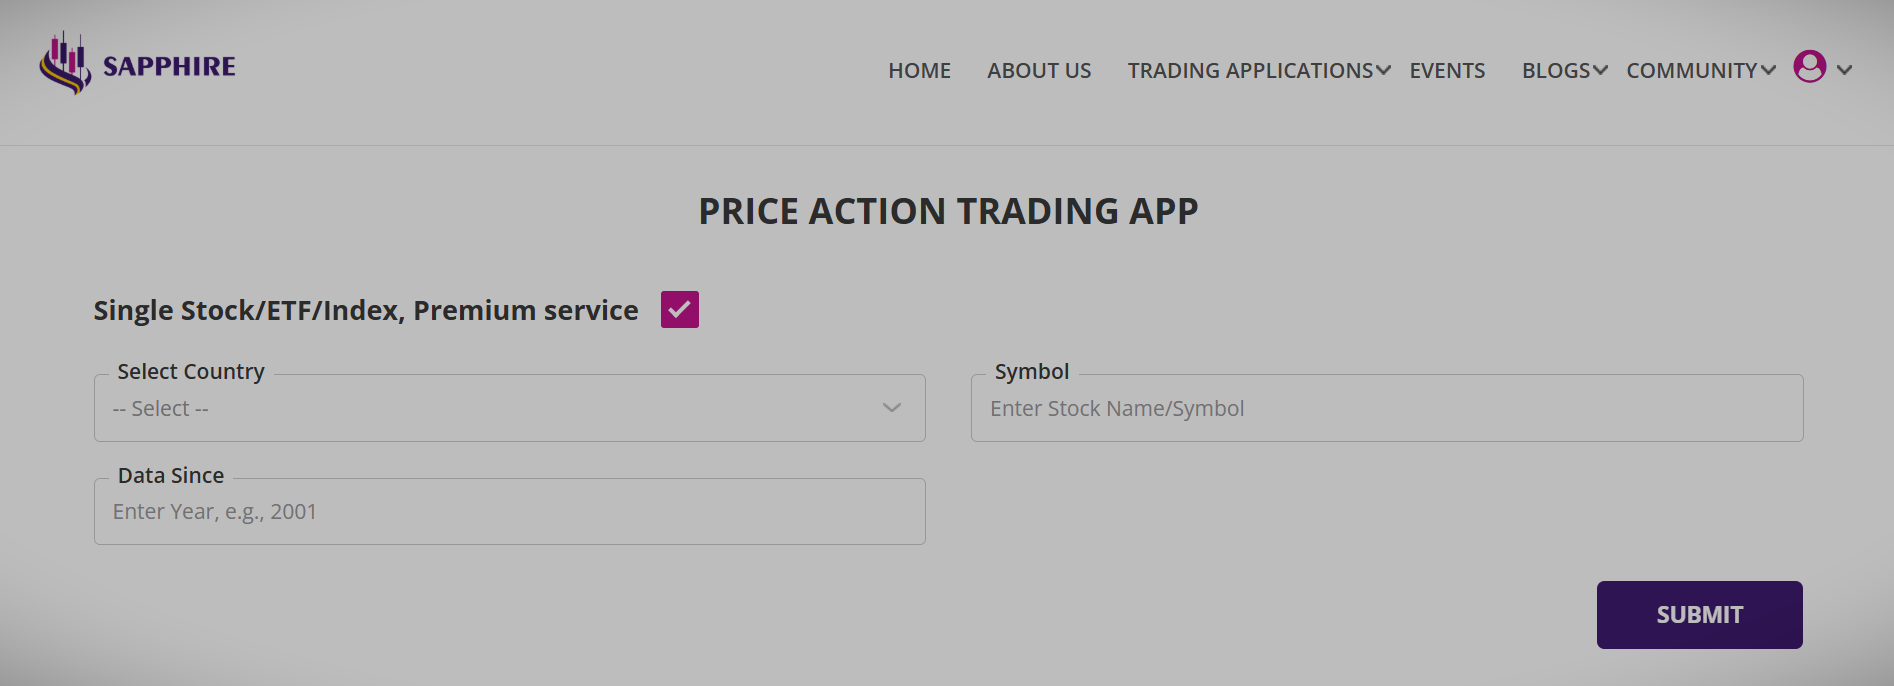
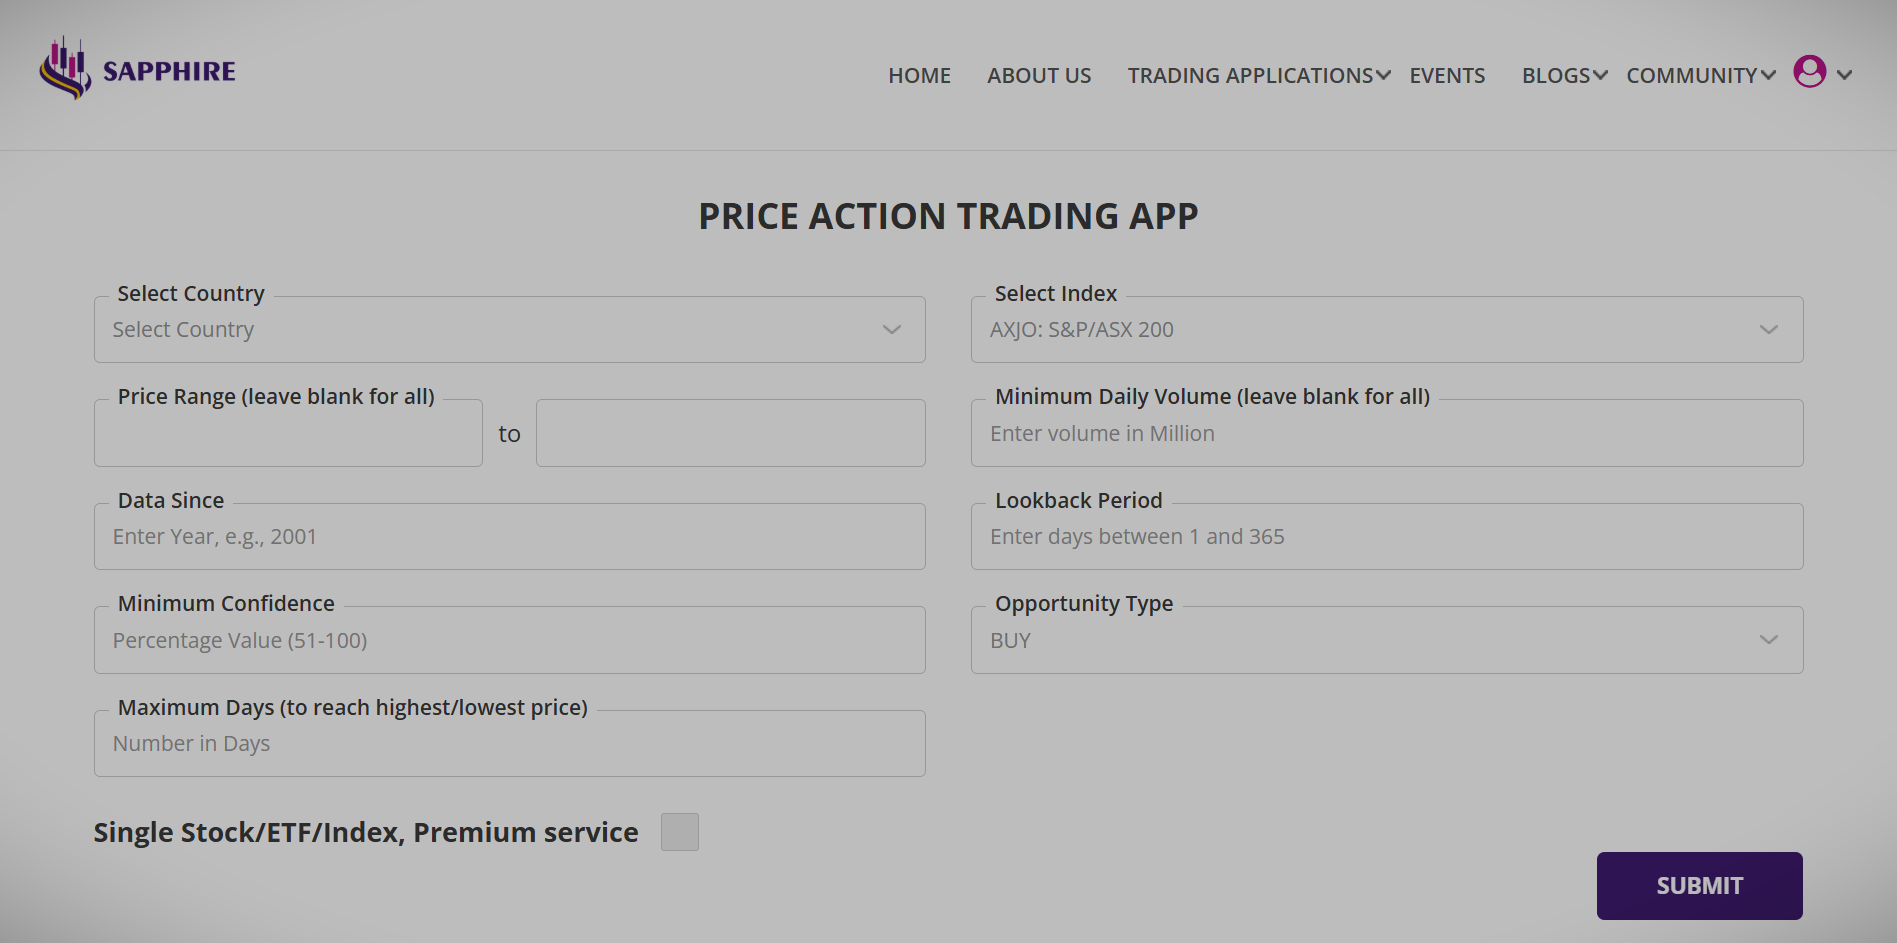
With the user selection of the country and index, look back period, minimum confidence, our Price action app begins to look into the stock database and look for recent and past patterns and produces a summary report of all possible open and closed trades listed with parameters of interest such as confidence, maximum move up, maximum move down and the time taken to reach those levels. Confidence is the percentage of the number of successful events compared to the total number of price action events during the observation period or years in data since.
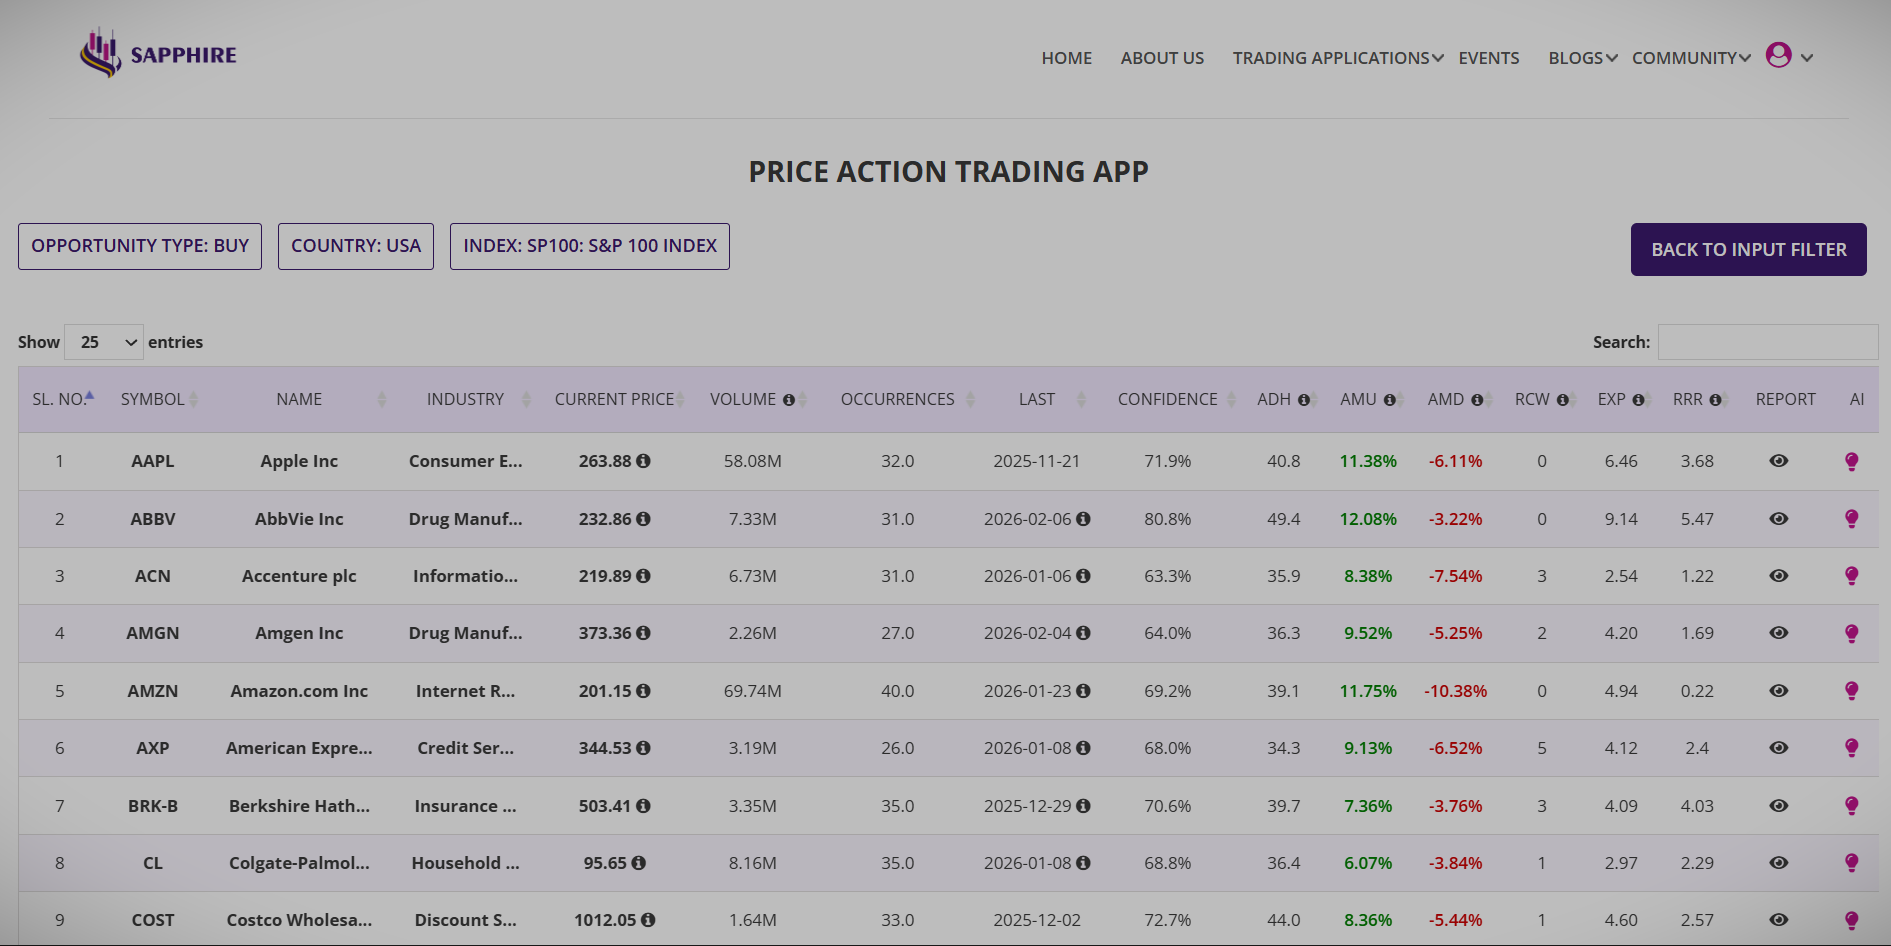
Each of the Stock or ETF listed in the summary report can be sorted to pick the best one to drill down to. The detailed report is available for each Stock or ETF listed in the summary report and provides wealth of information pertaining to each and every price action event, the open and closed trades, their individual performance and whole lot of details.
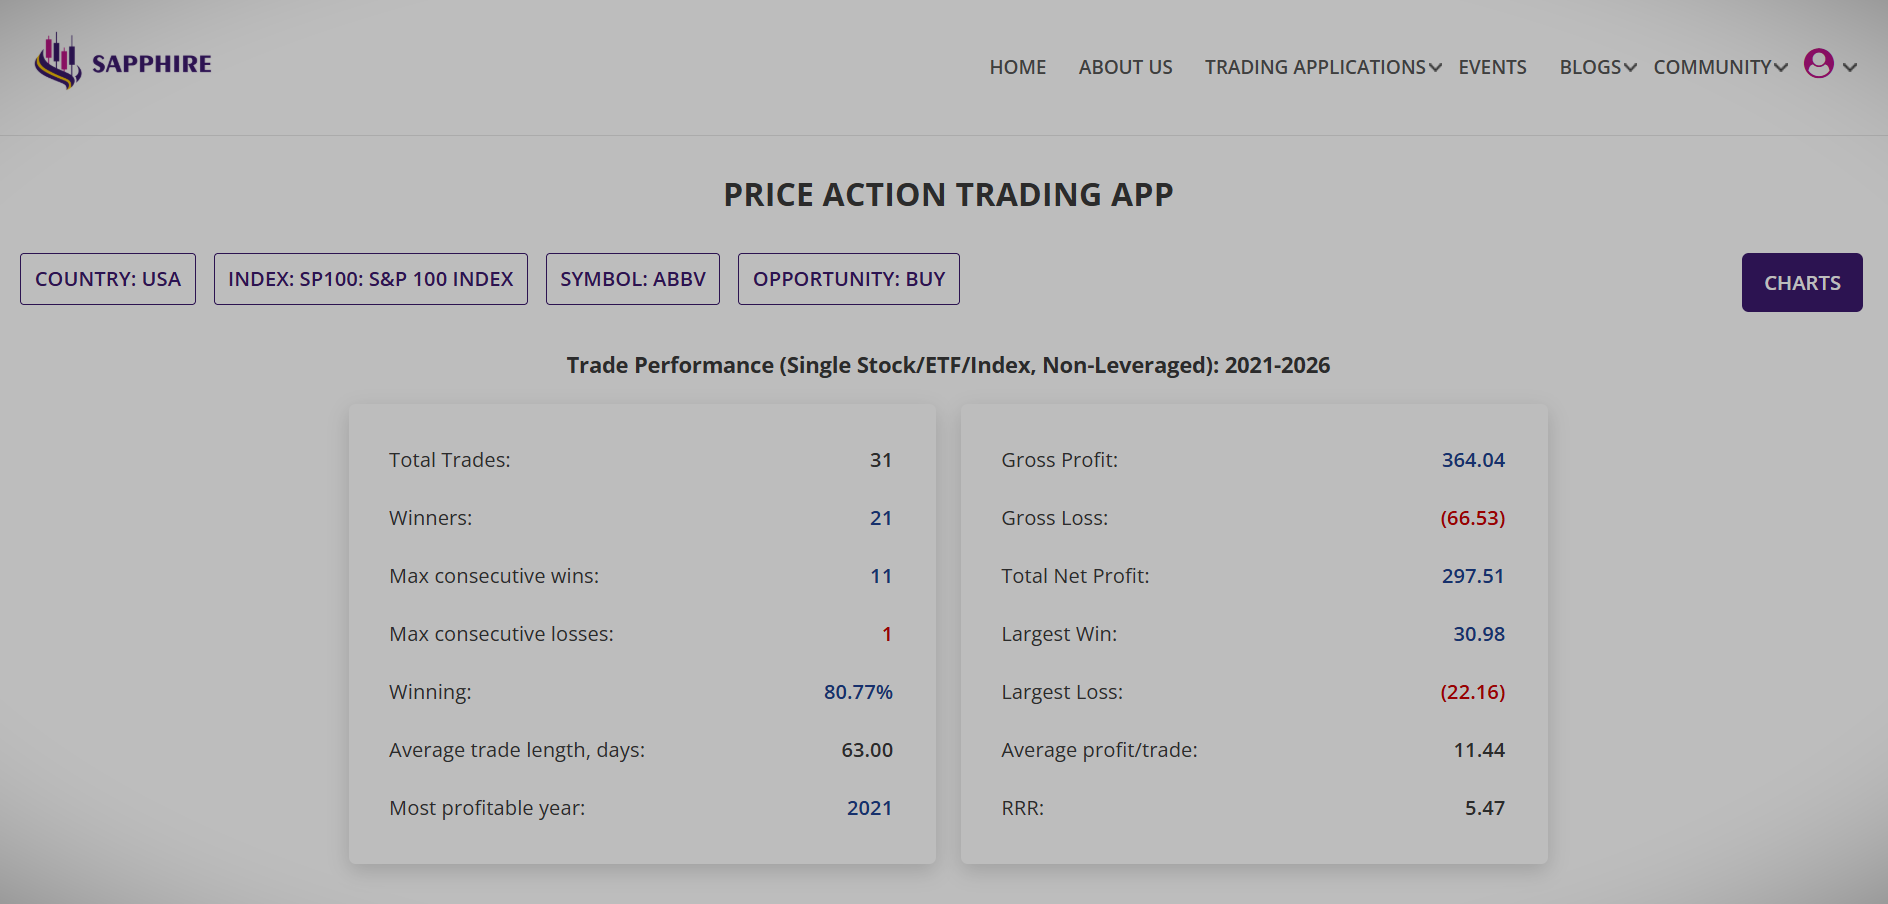
The top of the detailed report contains the aggregated trade performance for the number of events over the year since till date. There are several parameters of interest such as maximum consecutive wins, winning percentage, gross profit, net profit and reward-risk ratio (RRR).
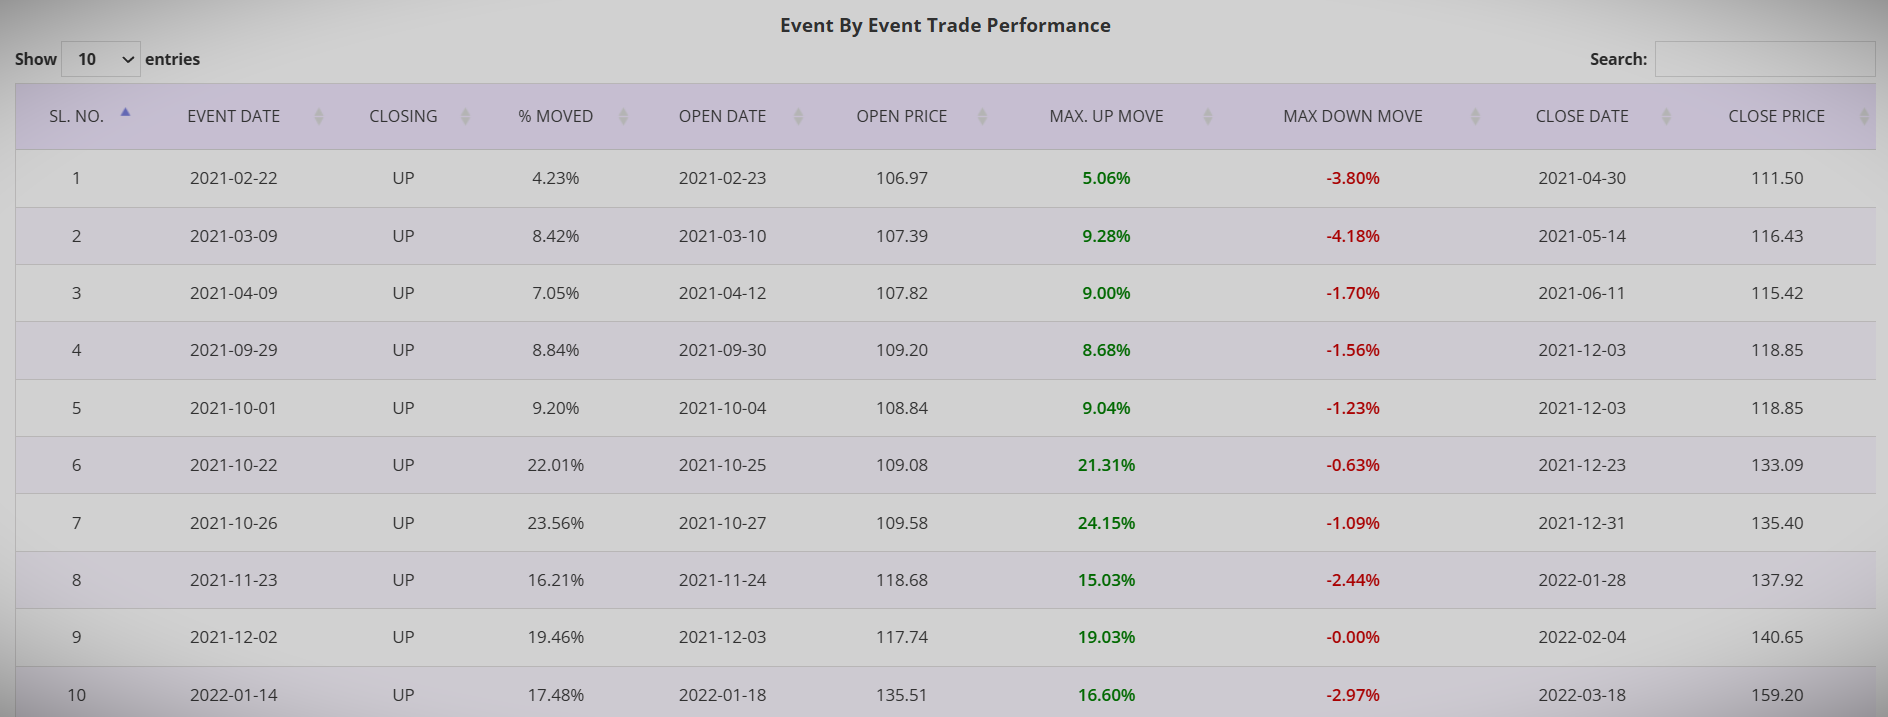
The detailed report provides trade performance for each of those price action events with a range of information including maximum move up, maximum move down and closing price in percentage from opening. Traders can slice and dice the numbers in the detailed report and can make educated decision about whether or not a recent price action event is tradable; and if yes, what to expect in terms of the draw-down and average move in favour.
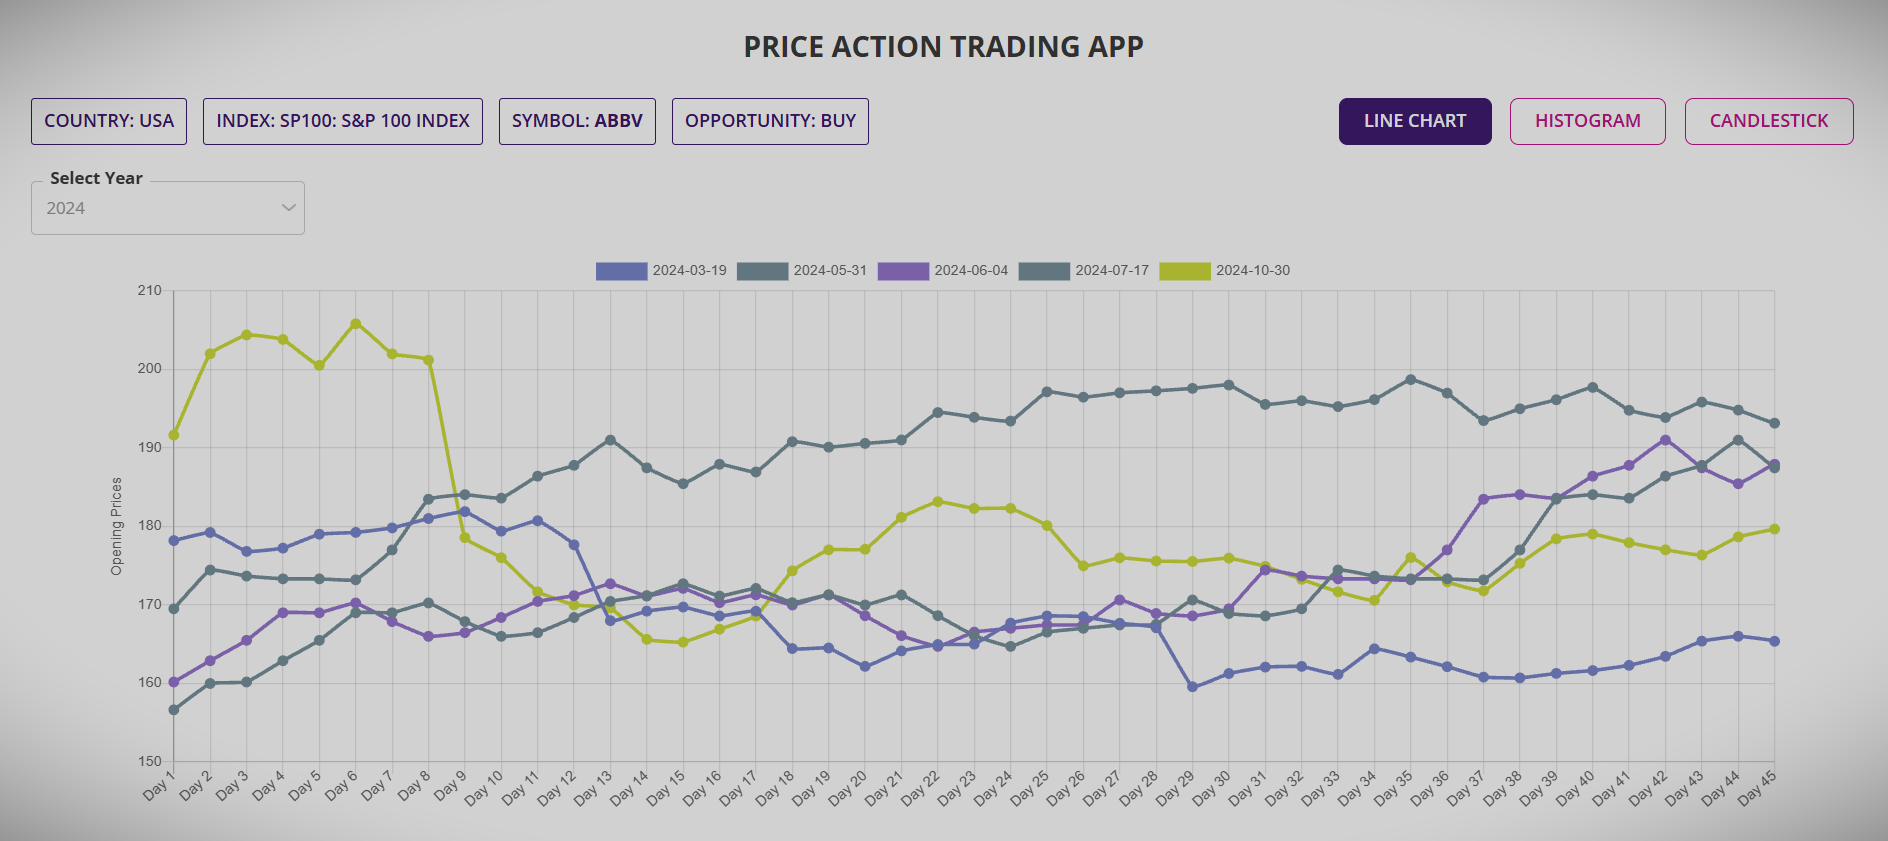
The interactive charting options provide even better insight into each of the past price action events. The line chart summarises all the events for each year of analysis.
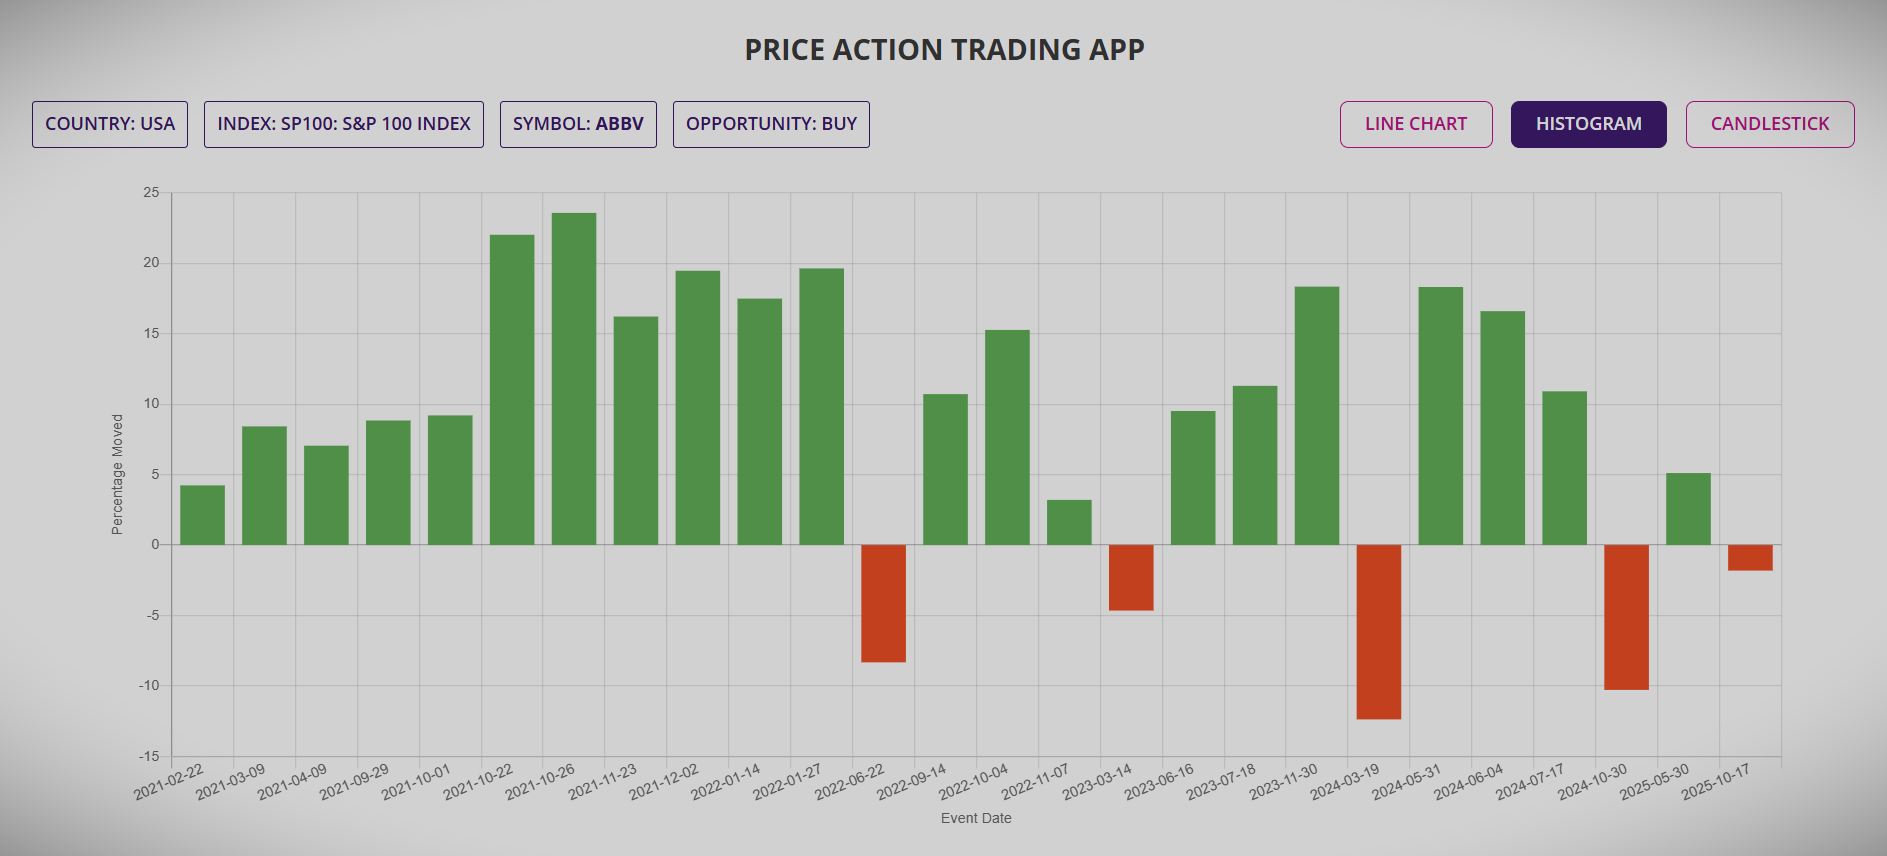
Histogram chart provides a complete picture of all price action events for the number of years of analysis and the percentage movement of the price in each of those events.
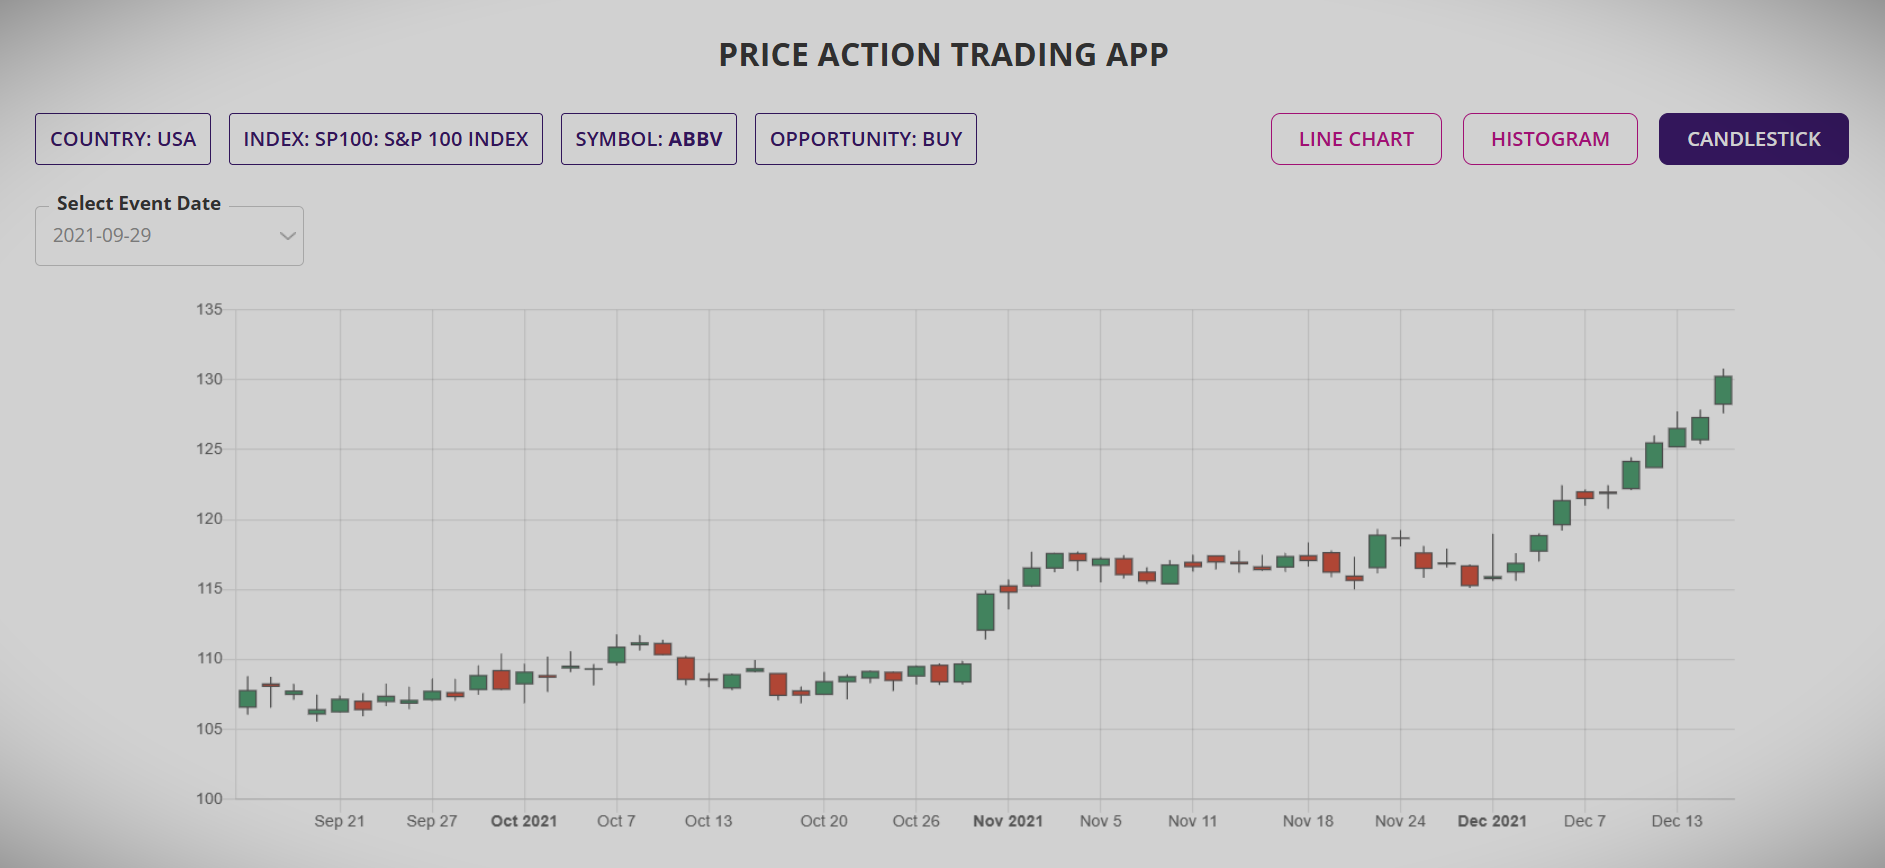
And finally, the classic candlestick chart to provide the real price action for each event for the number of years analyzed.
Which Stocks & ETFs Price Action trading app support?
Price Action trading app is currently available for all the Stocks in the major Indices and ETFs of the following countries in four continents:
- Asia: India, Singapore, Philippines, Japan, Hong Kong, Taiwan, Malaysia and China
- Europe: UK, Germany, France, Austria, Italy, Poland, Netherlands, Sweden, Switzerland, Spain, Portugal, Norway, Luxembourg, Ireland, Greece, Finland, Denmark and Belgium
- Oceania: Australia and New Zealand
- The Americas: USA, Canada, Brazil, Chile, Mexico and Peru
This makes up to more than 45,000 Stocks and ETFs across 150 indices in more than 30 countries.
How to trade with Price Action trading app?
Using the Price Action trading app is easy; input the country, input the index, look back period, the year since the events are required in the analysis and press submit. Our price action trading app will start looking for the price action patterns from past till date by employing a sophisticated algorithm using massive cloud computing infrastructure and performing billions of calculations to present a summary report.
If you need to drill down to further details before making the trading decision, please go to the detailed report for the underlying of interest.
Once the underlying is selected to trade, you could trade the underlying as it is in form of buy or sell or trade as derivative if allowed in your country. Look out for trading ideas in our video blog section or for learning more on how to trade.
Watch the video in this page, go the video blog section to watch the tutorial on how to use the app or simply book a session, online or live, if you would like to know more about our Price Action trading app.