Day trading is an adrenaline filled activity, often stressful
Day trading is a fascinating activity for retail and institutional traders alike. Day traders watch multiple charts of multiple Stock or ETF or other markets, sometimes in multiple timeframes with a range of indicators on those charts to assess the movement of the underlying Stock and ETF. Keeping a close watch on these charts, making assessment of how the market is setting up for a quick move and then placing opening and closing trades are what adds to the stress of a day trader. But from a day trader’s perspective, it keeps them engaged with the market.
How about if the day trader had prior knowledge about the Stocks or ETFs of historically making certain moves at certain hours of the day? Wouldn’t that be useful only to trade during those hours of the day, reduce stress from continually looking at charts and leaving the rest of the day for something else?
What is Intraday Seasonality Day-Trading app, how and why?
In a trading day, most particularly among the top Stocks and ETFs of the country, there is enormous amount of buying and selling frenzy by institutional investors, retail investors, hedge funds and all. This buying and selling frenzy during the trading hours create a seasonality pattern that lives in the market from anywhere between five days to one month. These daily seasonality patterns occur for a variety of reasons such as institutional investors slowly loading or unloading the Stock or ETF in their portfolio at certain times of the day or certain news, effect of which lingers over a period of time. Although knowing the reason is not perhaps as important as it is to know that these patterns regularly occur for most of the top Stocks and ETFs in all markets around the world.
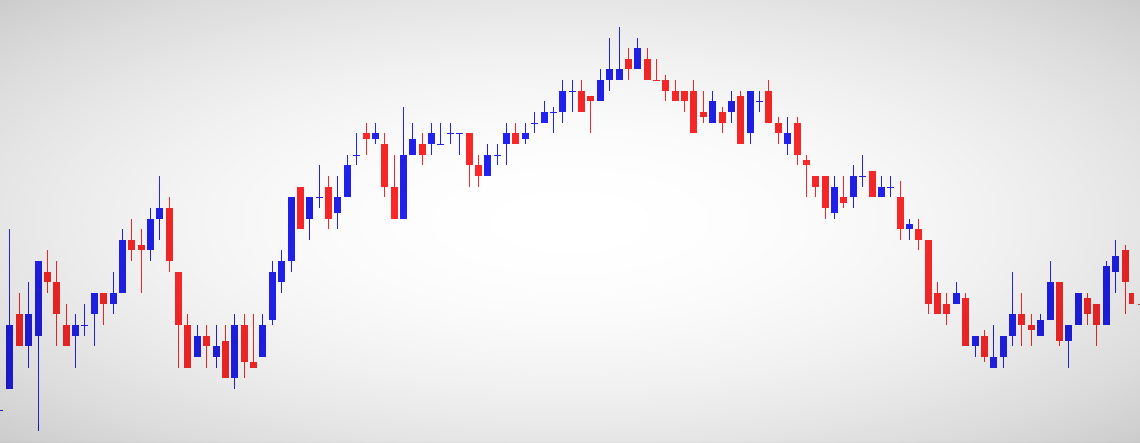
To understand how the daily seasonality patterns occur and work for day traders, let’s look at the daily candlestick chart of any Stock or ETF, each of these candlestick representing one trading day. There is hardly any information that can be used for day trading purposes.
Now, if we pick any day or any one candlestick in the daily chart and break it down to a 1 minute or 5 minute chart, it looks like this. This is the information that is condensed in one candlestick of the daily chart but this provides more information about the movement of the Stock or ETF during the trading hours of the day. Not only we can see the opening price, day high, day low and closing price but most importantly, the movements among these levels at various times of the day.
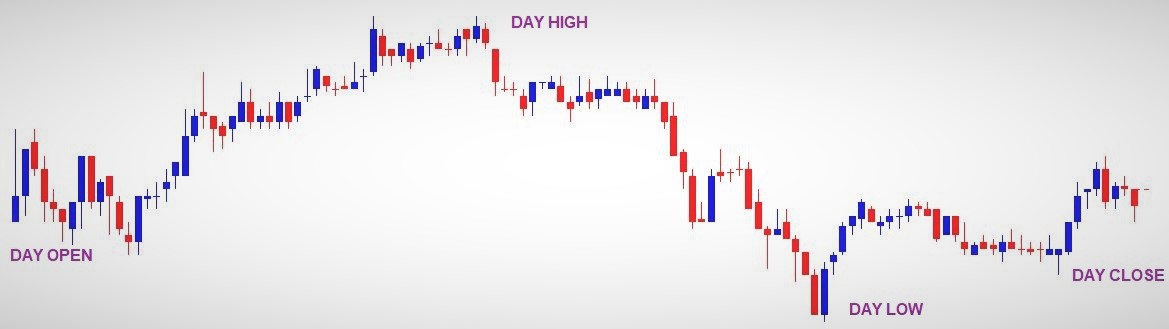
There is plenty of information for a day trader in this chart. Since the opening of trading on the day, the underlying Stock or ETF price moved UP and moved DOWN and then closed. There is a distinctive move UP at the beginning followed by move DOWN before close.
How does Intraday Seasonality Day-Trading app work?
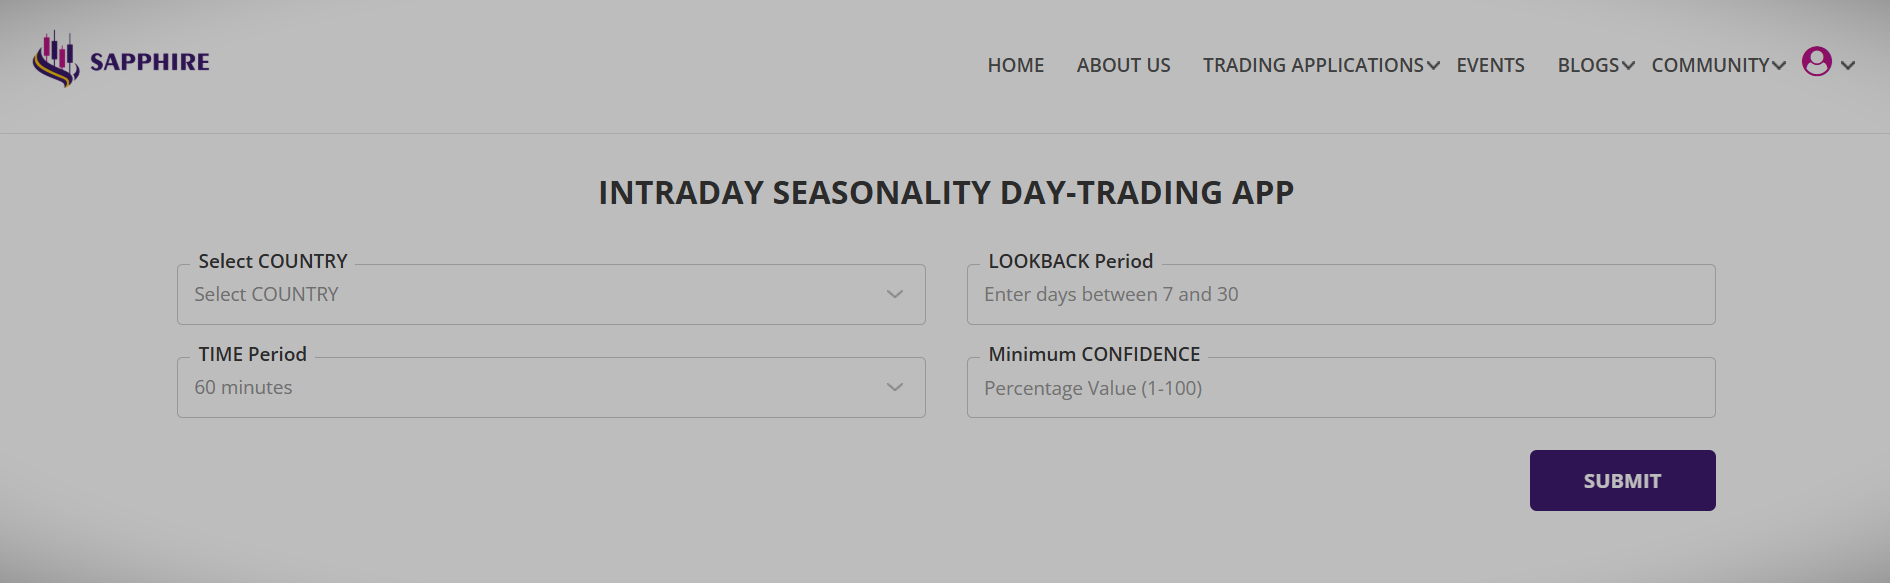
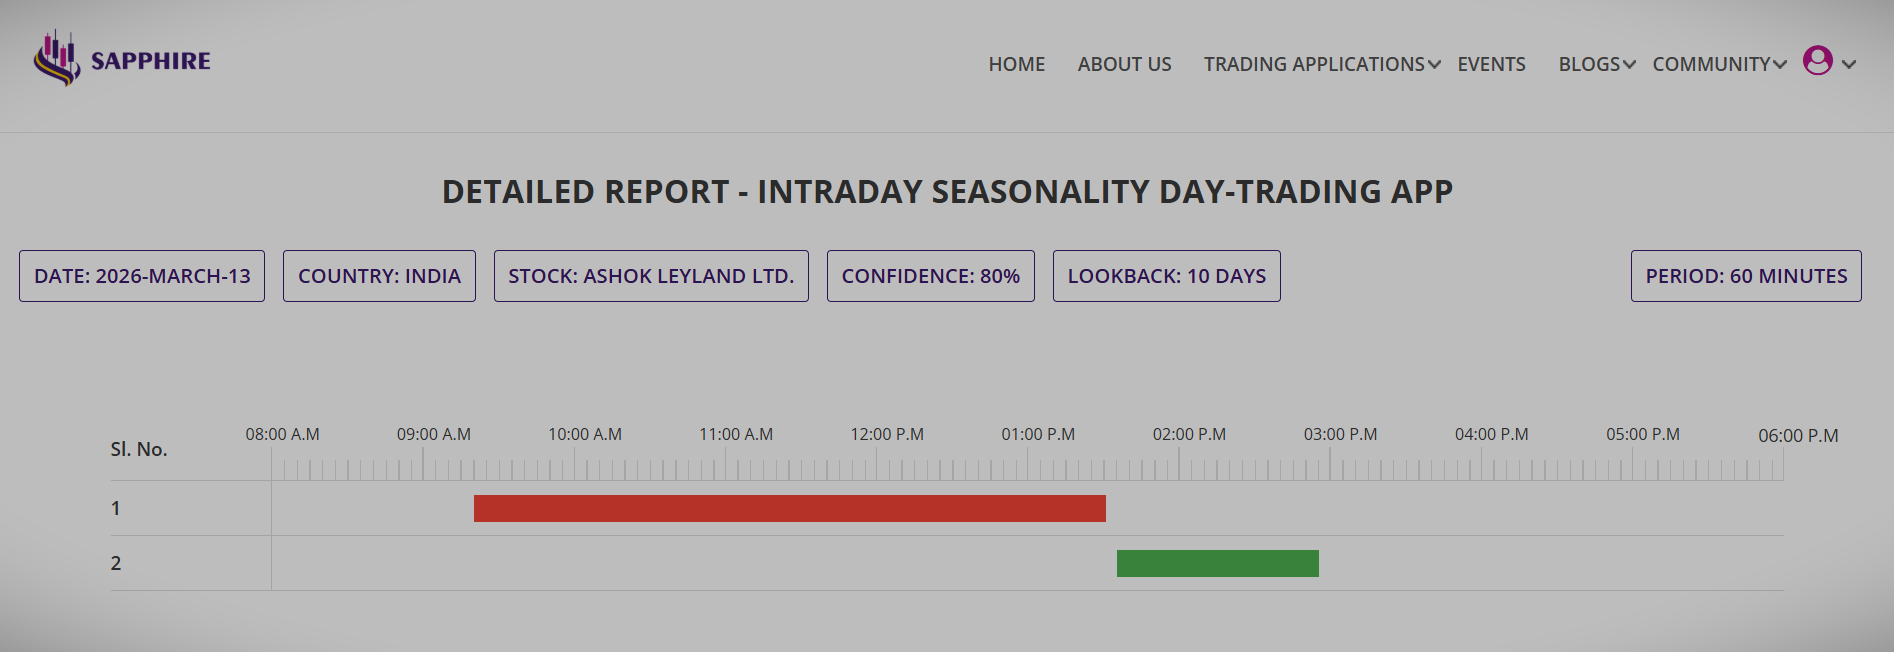
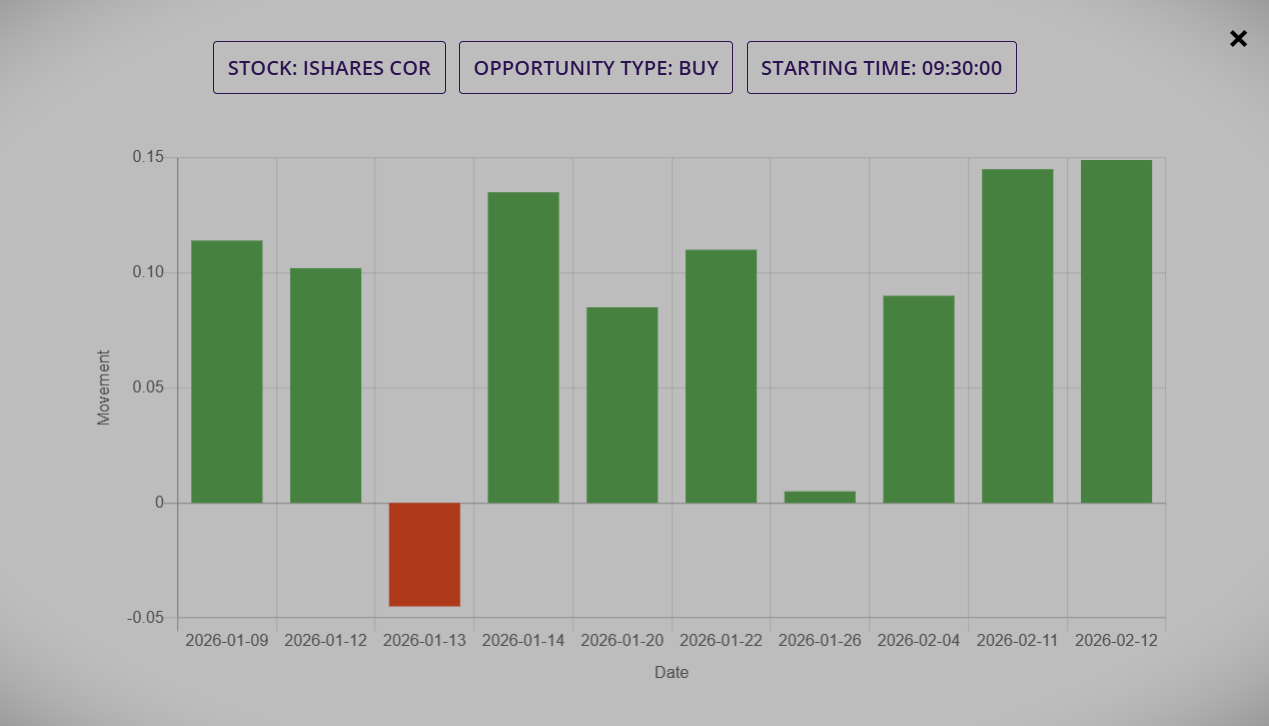
Our Intraday Seasonality Day-Trading app looks for matching pattern like this across the top Stocks and ETFs and provides a summary report of list with Stocks and ETFs that has consistent move up or down at certain times of the day down to five minutes and the size of the movement that meet the minimum confidence criteria.
The summary report is an intuitive and interactive bar chart showing the time of the day during which the Stock or ETF had a consistent move up or down and the direction.
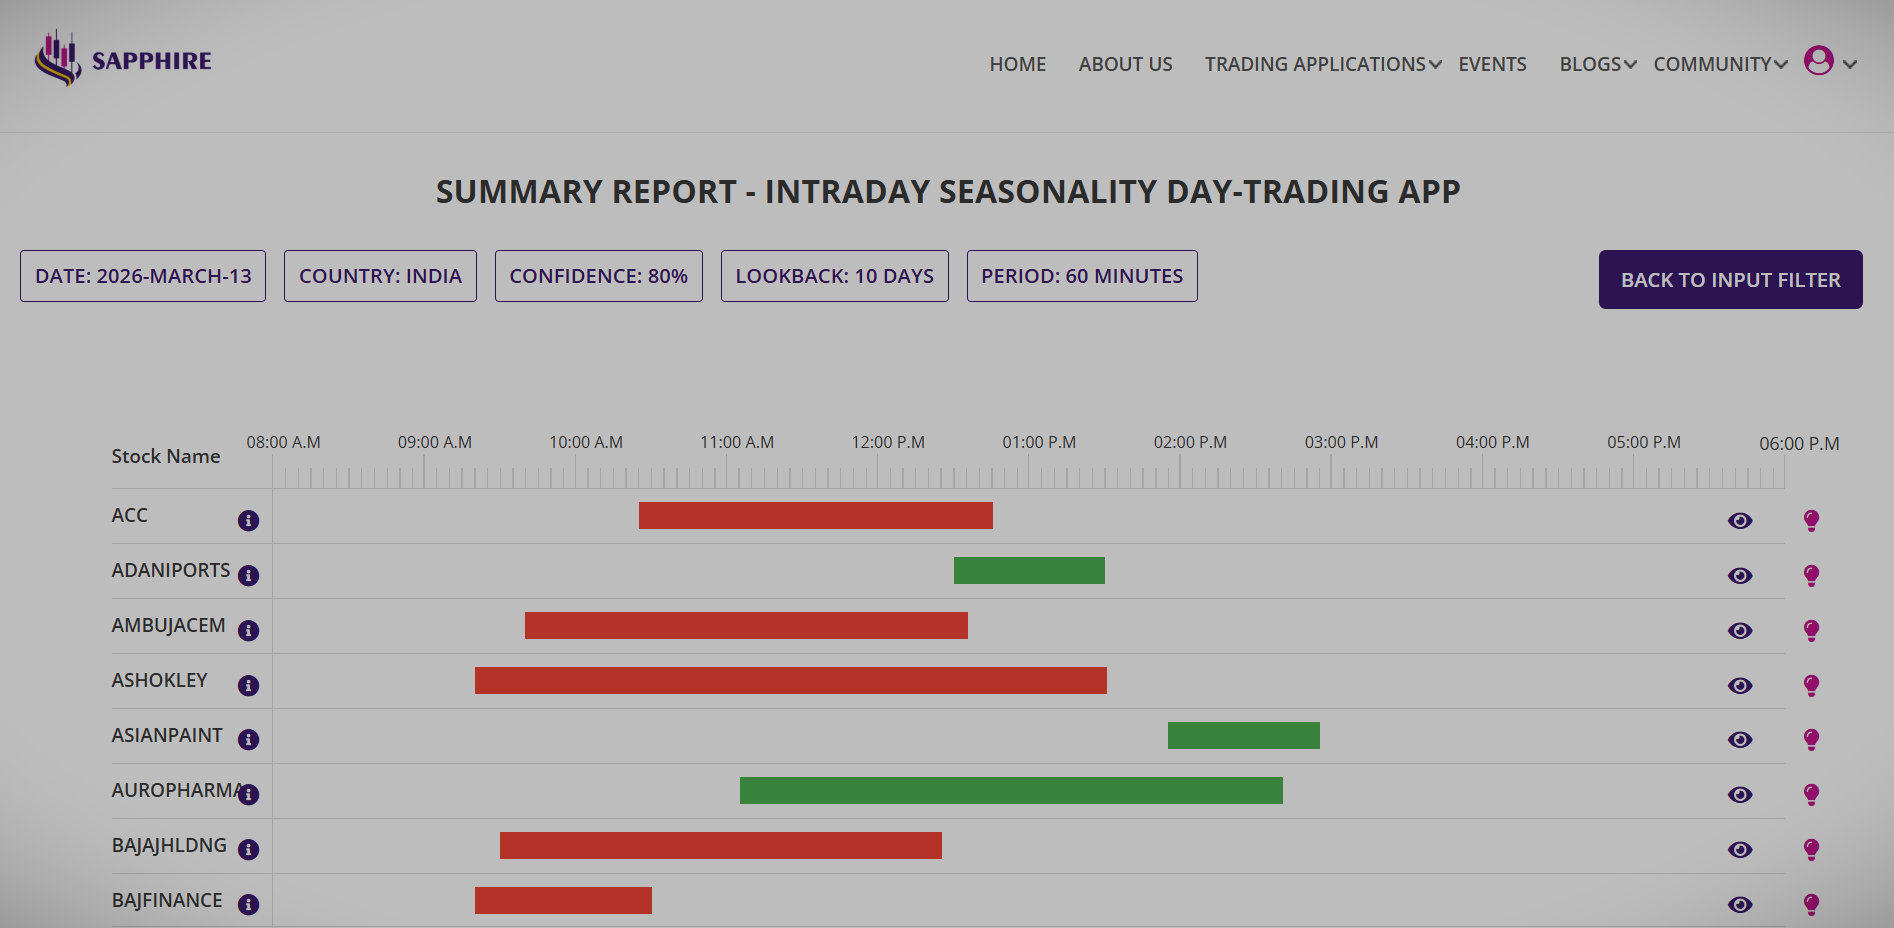
See, how each of these days perform in terms of the movement of the underlying for the time period shown in the summary report.
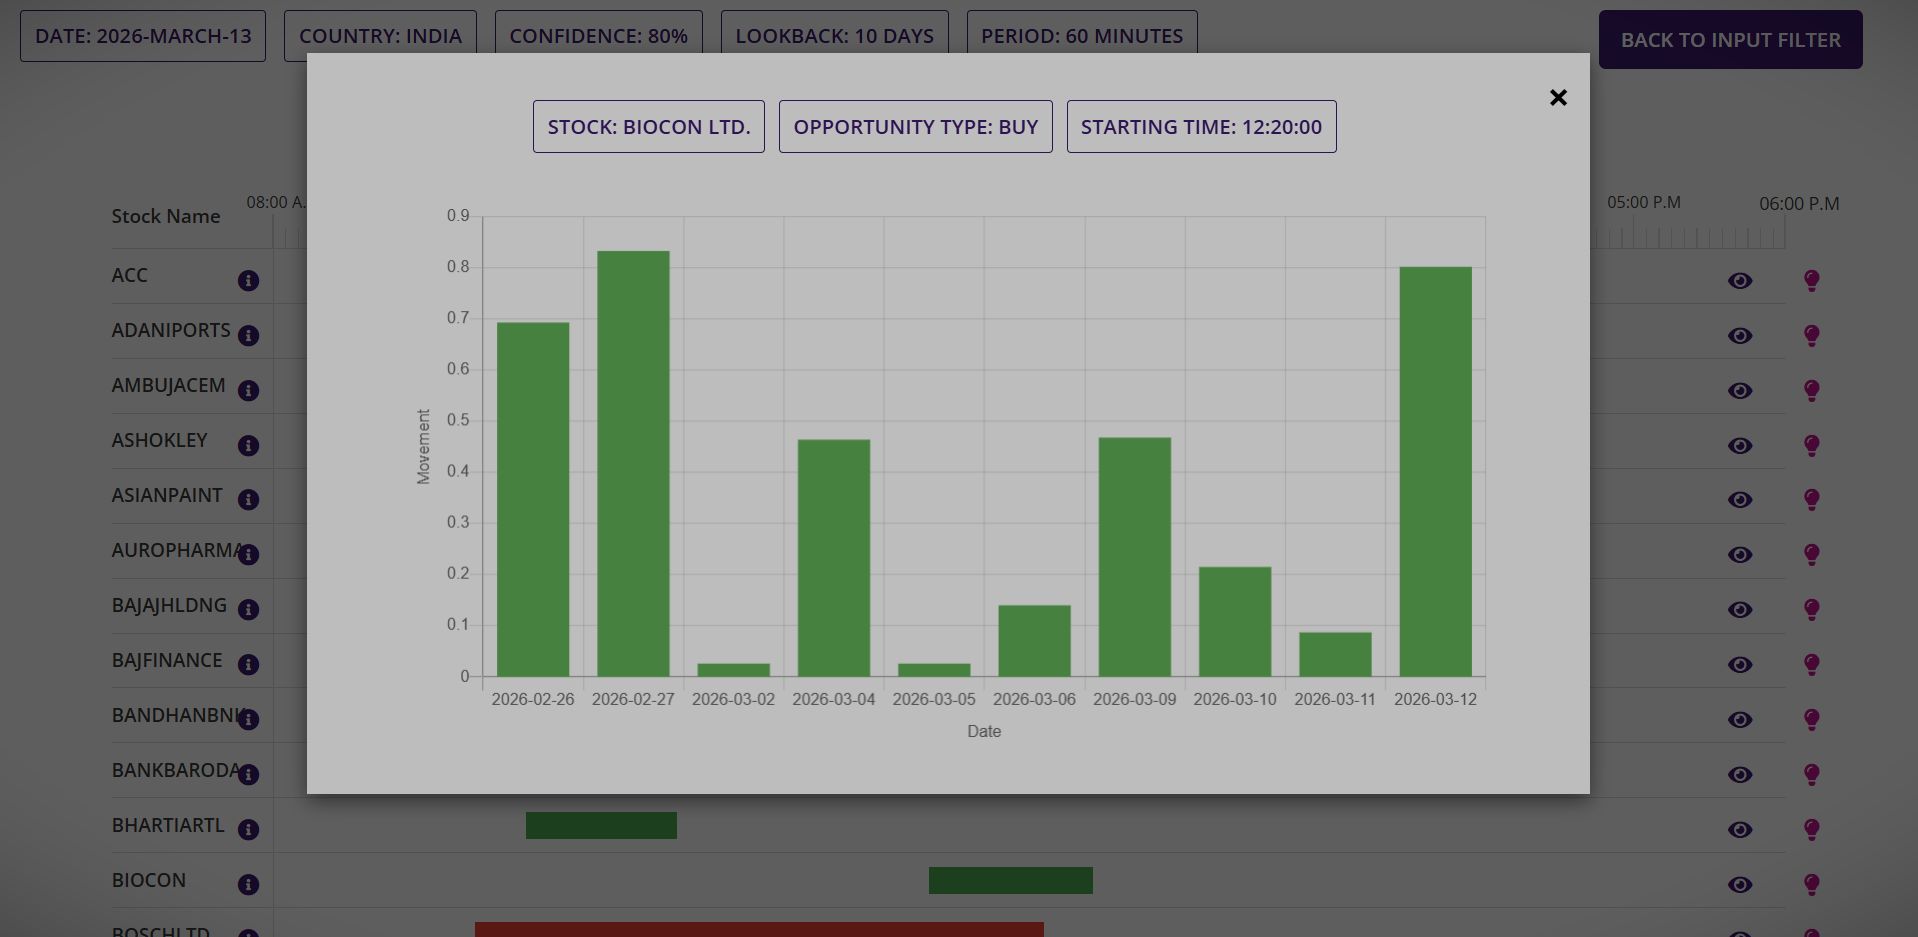
Each Stock or ETF in the summary report can be drilled down to explore if there were other Intraday seasonality time window for the same days for that Stock or ETF.
Get to know how and by how much the Stock or the ETF of your selection moved during the hours of the day in a detailed histogram chart. Same histogram chart is also available from the detailed report for the hours in which intraday seasonality existed.
Which countries Stocks & ETFs Intraday Seasonality Day-Trading app support?
Intraday Seasonality Day-Trading app is currently available for top 50 to 100 Stocks from the following countries: Australia, India, UK and USA. The top Stocks mean the Stocks with the top market capitalization, highest weightage in the main index of the country and high liquidity.
For USA, the top list also contains the top ETFs by market capitalization such as SPY, DIA, EEM, GLD and the likes.
How to trade Intraday Seasonality?
Now that the Intraday Seasonality Day-Trading app is providing the details of the time of the day when the underlying Stock or ETF is going to make the large move, the trader can day trade only during those hours of the day. The type of trade that you can place using this information will vary depending upon the country you are from, and the broker you are with.
As an example, if you are from a country where derivative trading restrictions apply, then the Stock or ETF could be traded as it is for intraday trading. Please check with your broker if leverage is available for intraday trading and also if any other conditions apply.
If you are trading from a country where CFD and Options trading are allowed, then you could take several types to trades and manage your risk better. As an example, if you would like to trade single Option with the intraday exposure, you could take advantage of long ATM Option with 7 to 10 days to expire and profit from positive move of the underlying. Or you could create a multi-leg Options spread to minimise risk while taking profit from the upside.
In any case, strict money management is the key to successful trading. Keep position sizes small and risk a small fraction of the trading capital so that if the probability does not play out in your favour, your exposure is limited and you can trade another opportunity another day.
Watch the video in this page, go the video blog section to watch the tutorial on how to use the app or simply book a session, online or live, if you would like to know more about our Intraday Seasonality Day-trading app.