What does Seasonality mean for traders?
Imagine knowing every week of the year, which underlying Stocks or ETFs are going make big moves, what high and low levels are these underlyings going to reach, time it is going to take to reach those levels and what are the probabilities of those moves happening. Study of Seasonality provides not only answers to these questions but also further details so that a trader can make an informed decision before placing the trade.
It is like a calendar or schedule that runs like clockwork that a trader can take advantage of. Seasonality reveals the repeatable patterns that traders are able to exploit by knowing which Stocks or ETFs are set up to make large moves. Here are few examples of how the study of Seasonality is able to provide actionable insights for trading:
- Australia: AMP Limited (ASX: AMP) goes UP by an average of 5.4% over the same 20 trading days more than 90% of the time for the past 20 years;
- India: Tata Motors Limited (NSE: TATAMOTORS) goes UP by an average of over 17% over the same 43 trading days 90% of the time for the past 10 years;
- UK: Glaxo Smith Kline Plc (LSE: GSK) goes UP by an average of 7.8% over the same 34 trading days 85% of the time for past 20 years;
- USA: Cisco Systems stock (NYSE: CSCO) goes UP by an average of 7.7% over the same 10 trading days more than 80% of the time for the past 15 years;
and likewise for most stock markets around the world.
So when you pick one of these trading opportunities, you are trading with positive expectancy as each of those has a very high probability that the pattern is most likely to be repeated based on the historical performance or confidence.
How to use the Seasonality trading app?
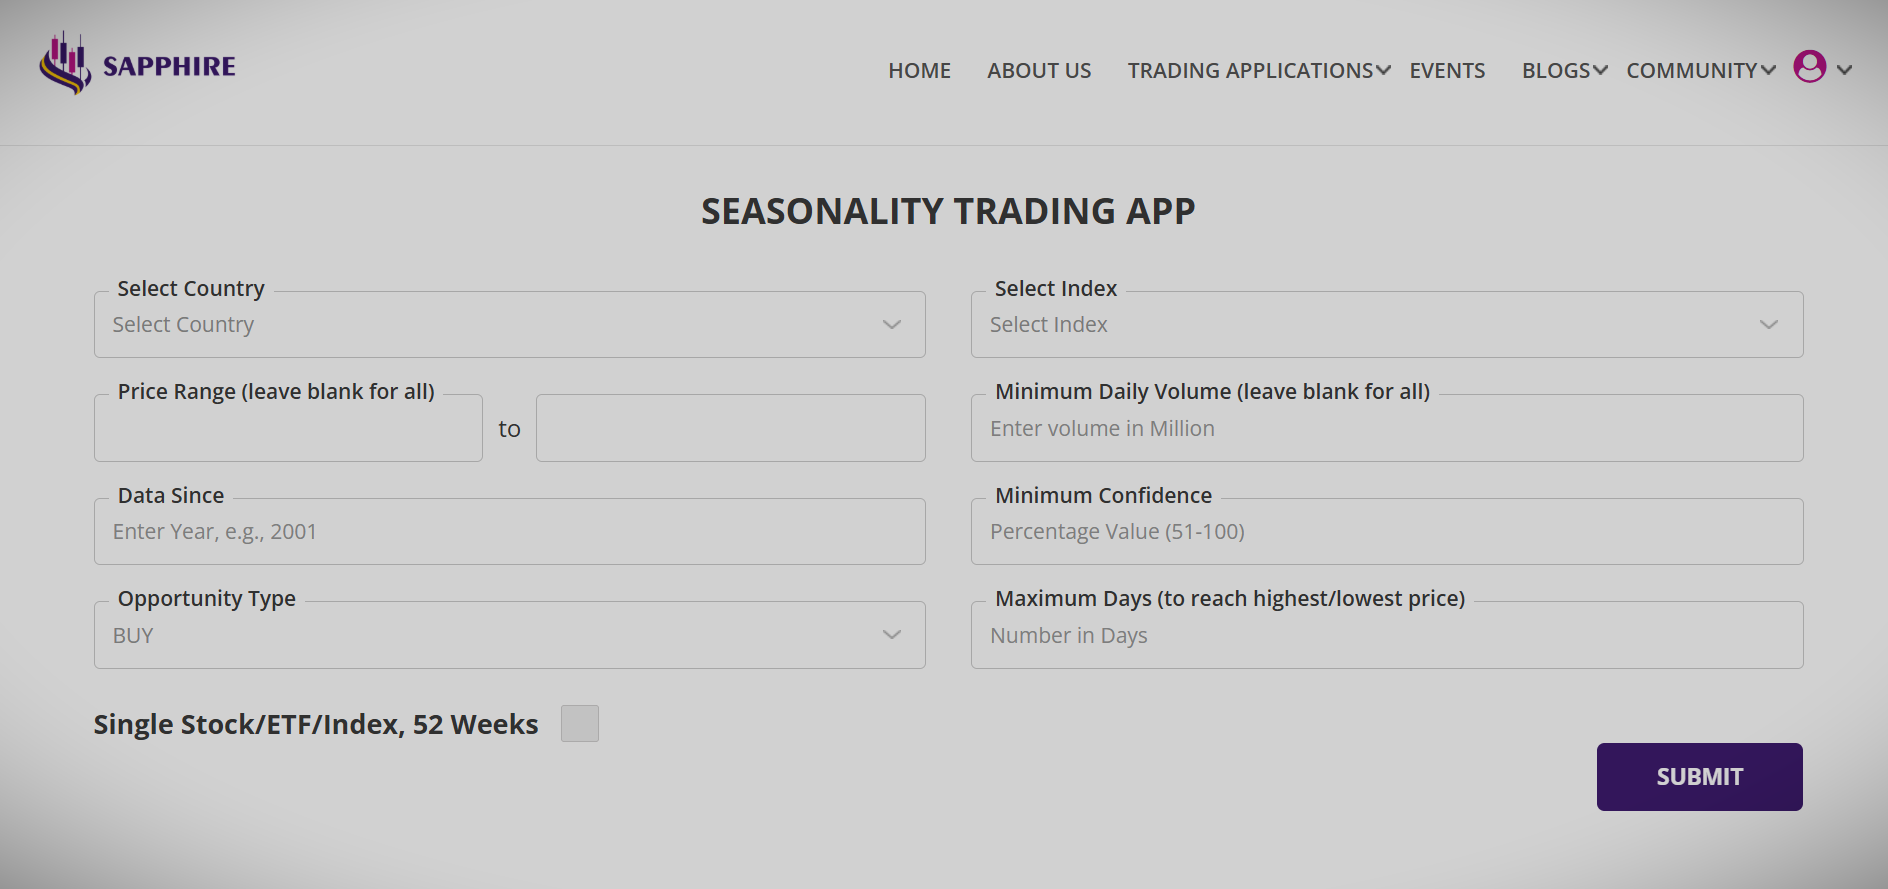
Our Seasonality trading app has been designed to be simple and intuitive, yet the most power tool to provide the seasonality patterns of Stocks and ETFs with all the details you would need before you make the trading decisions.
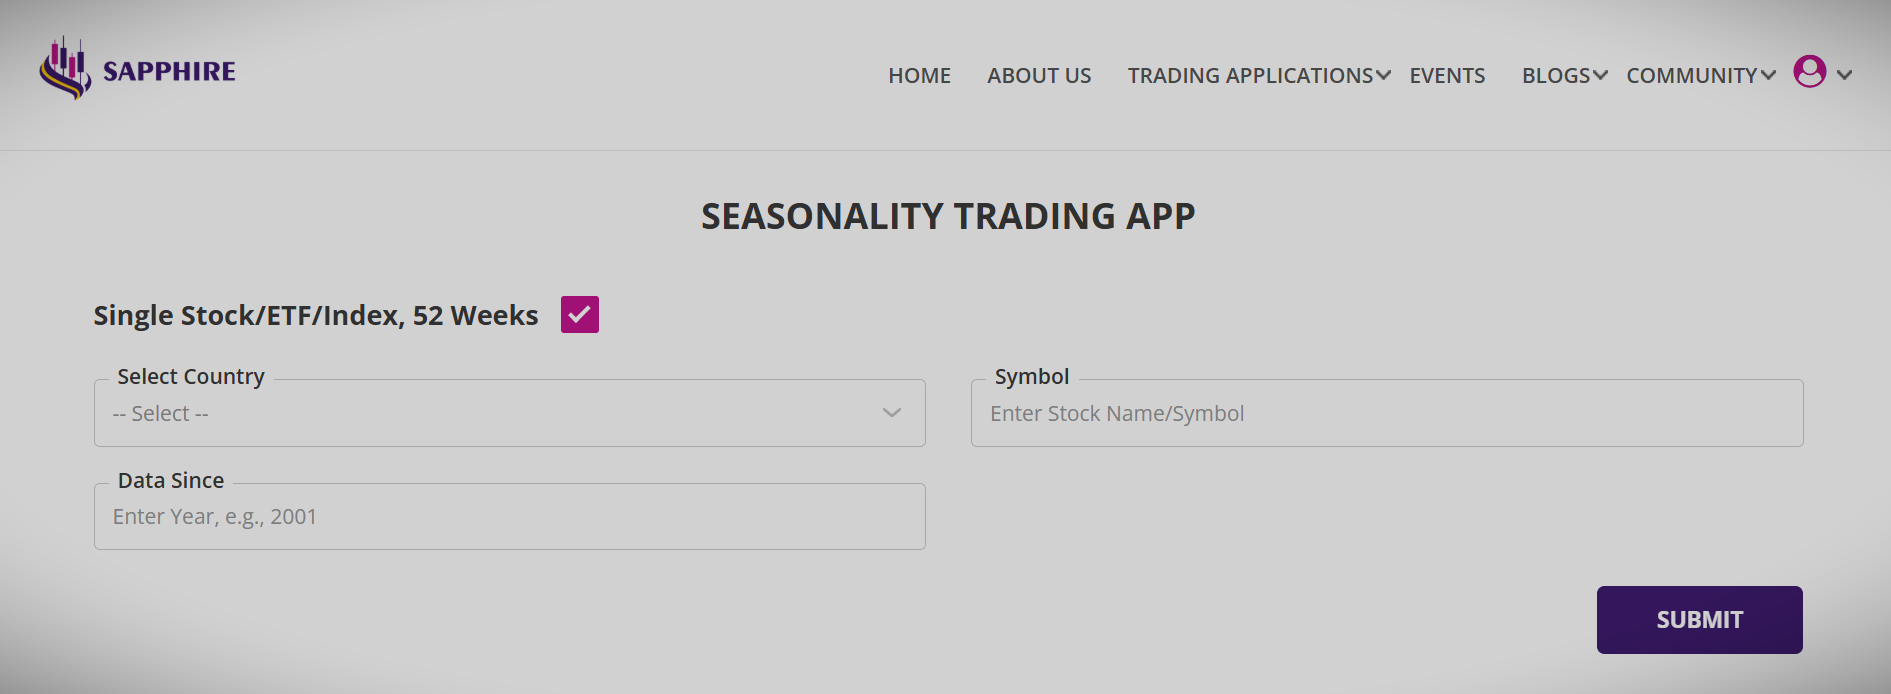
Input the country, index you are interested in, select whether you are looking for Long or Short opportunities, how many years of historical data you would like to look at for the seasonality pattern and finally what minimum confidence of the pattern are you looking for. Confidence is the percentage of the number of successful outcome of the patterns to the number of years. As an example a confidence of 90% means that the pattern was successful in 9 years out or last 10 years of analysis.
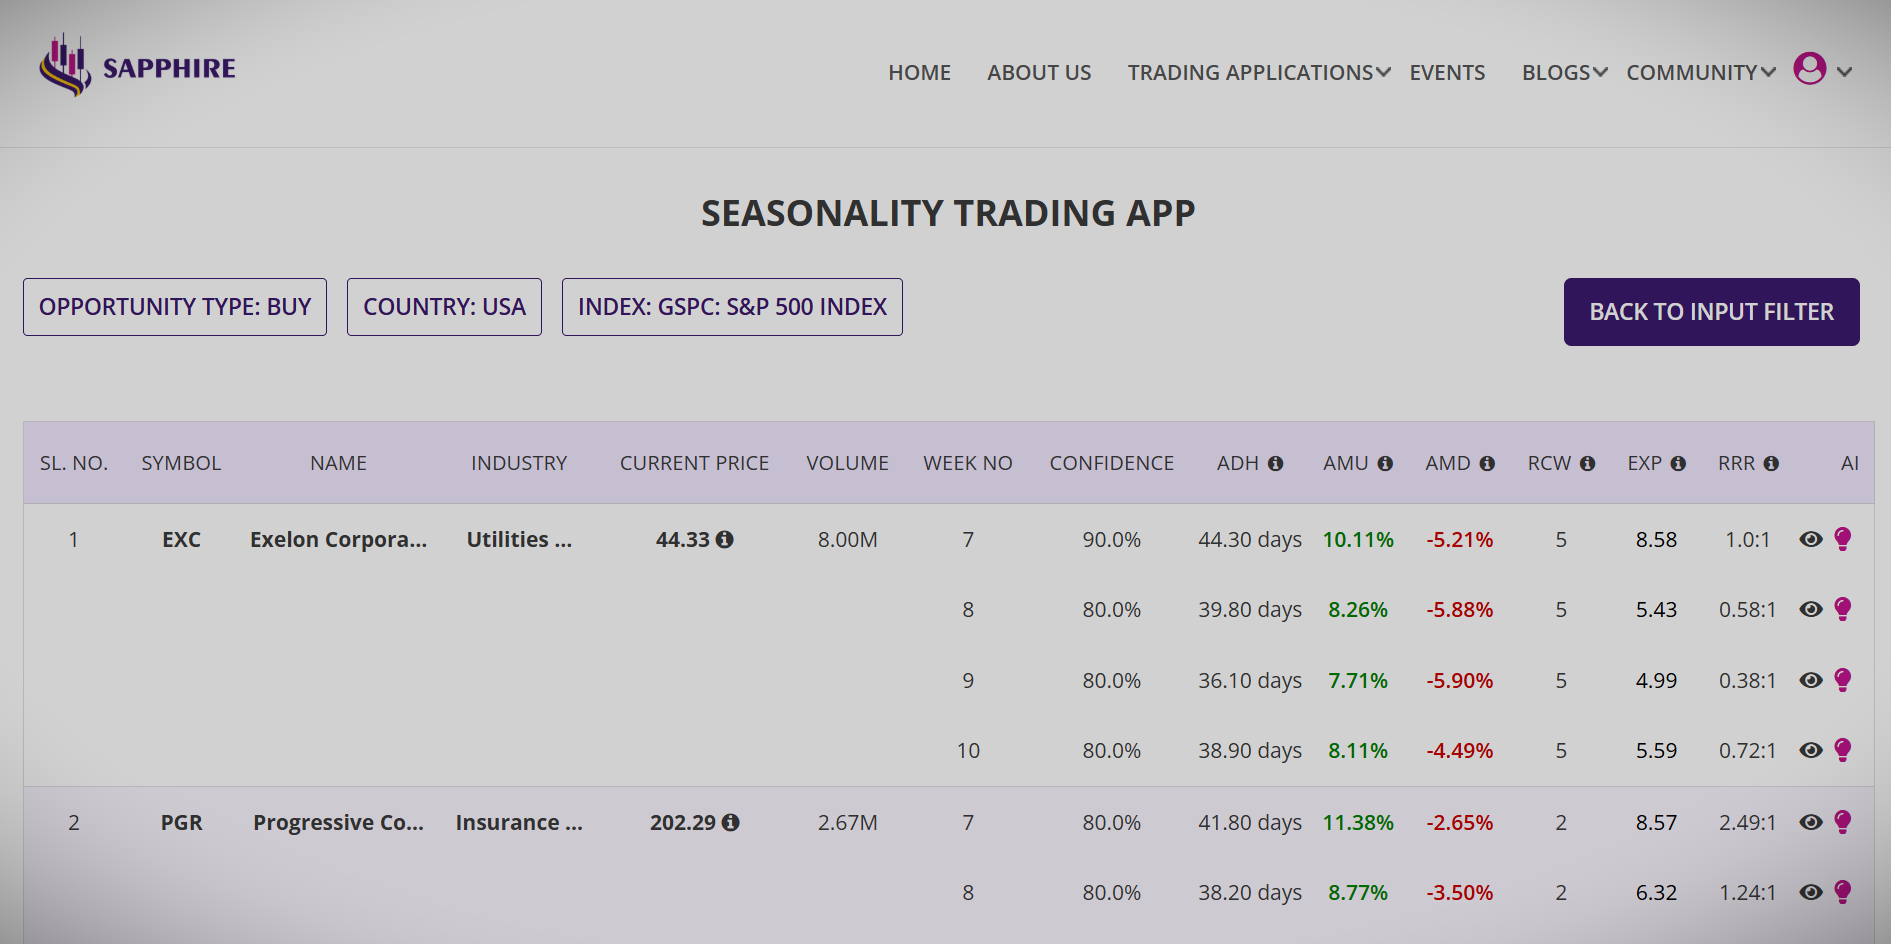
For better insight into the quality of the Seasonality pattern, the Summary report lists four weeks worth output for each stock, beginning next trading week from the week the app is run. The Stock or ETF are listed alphabetically with all critical parameters of interest such as volume traded, average move up and average move down, average time taken to reach the highest or lowest points during the nine weeks period and two proprietary parameters providing even better insight of the quality of these Stock/ETF's Seasonality features.
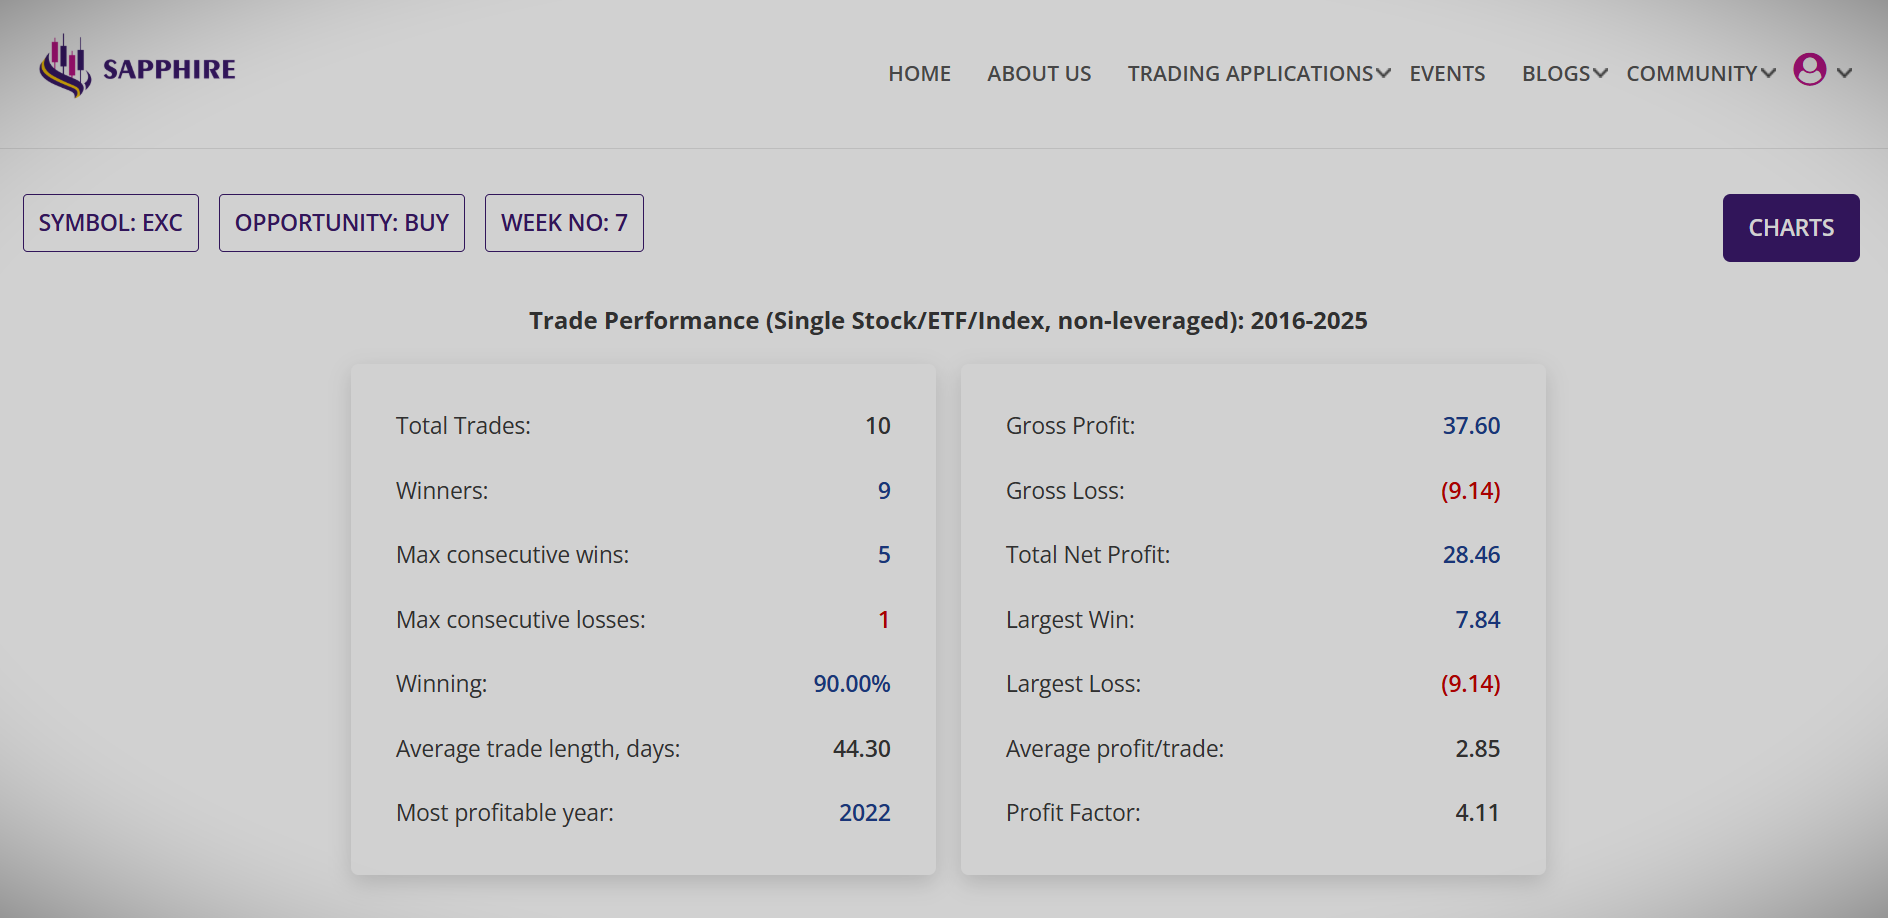
Each of the summary report lines can be drilled down for a detailed report. The detailed report provides the insight for the Stook or ETF of interest to the trader and this can be accessed for each week of the Stock or ETF from the summary report, providing detailed insight of trades in each of the previous years of data since, during the nine weeks period.
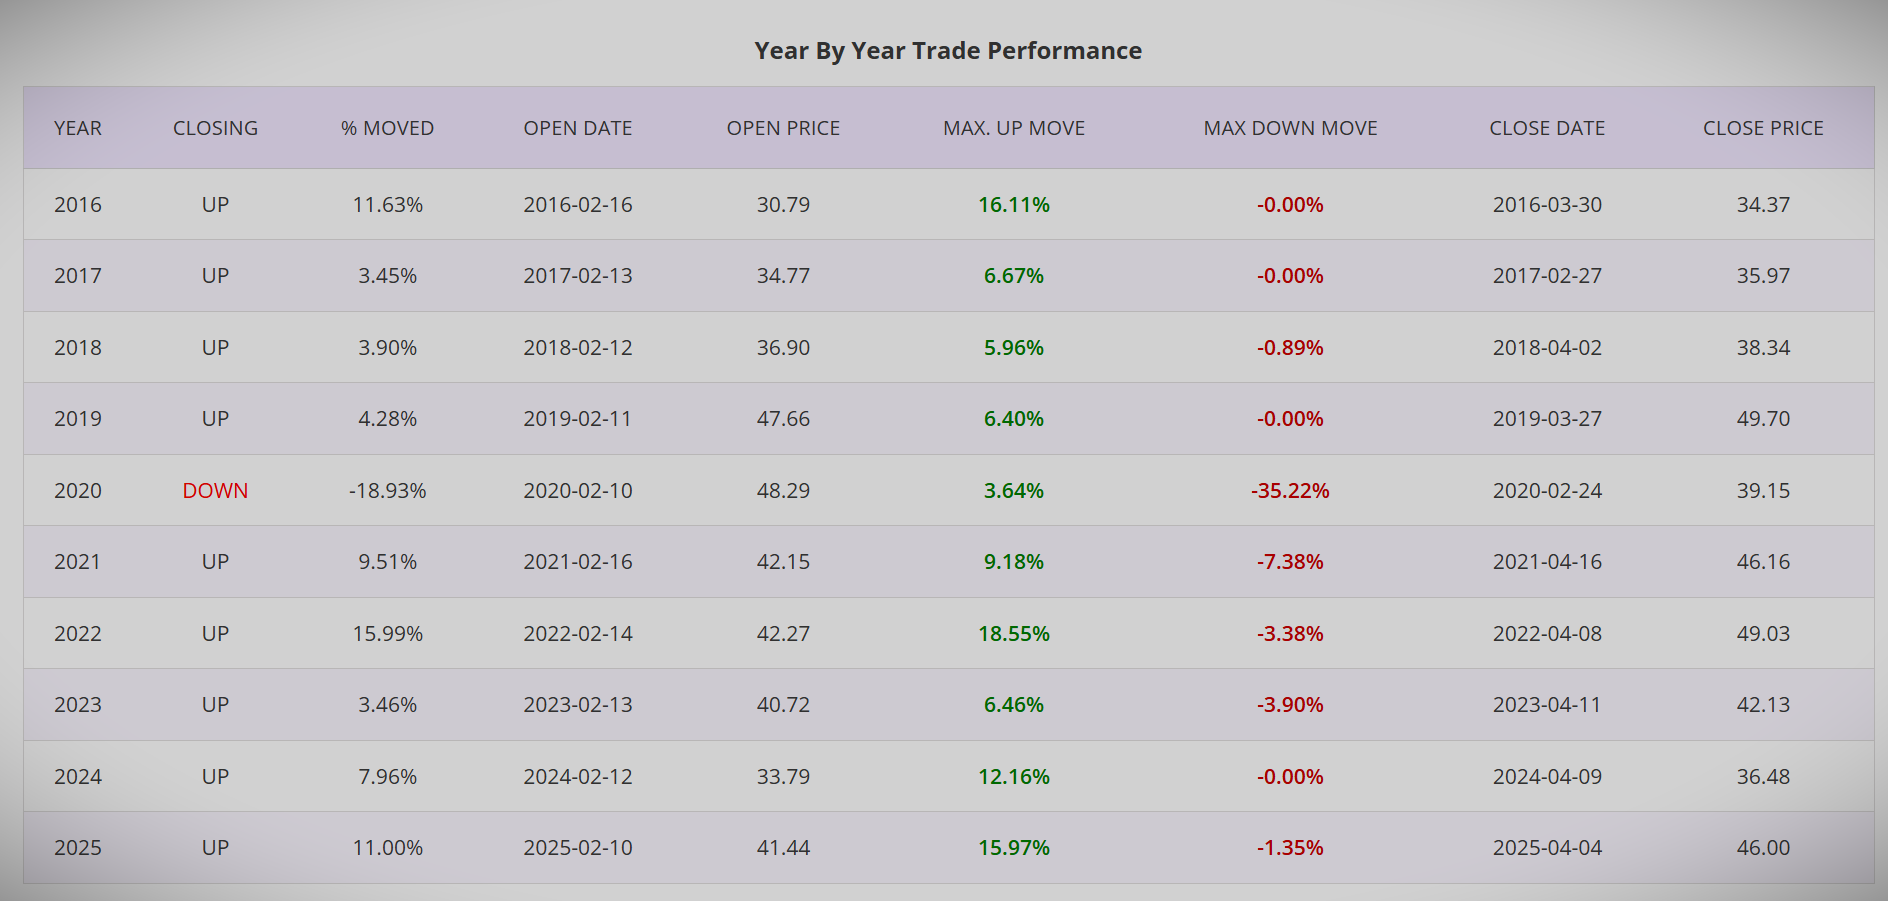
The detailed report has two tables, the one at the top of the report is the trade performance table which summarises the trading results if one single unit of the Stock or ETF was traded for the number of years for which the analysis was run.
The year by year report provides details of the trade in each of the year since, the maximum move up, maximum move down, closing of trade after nine weeks after it was opened etc.
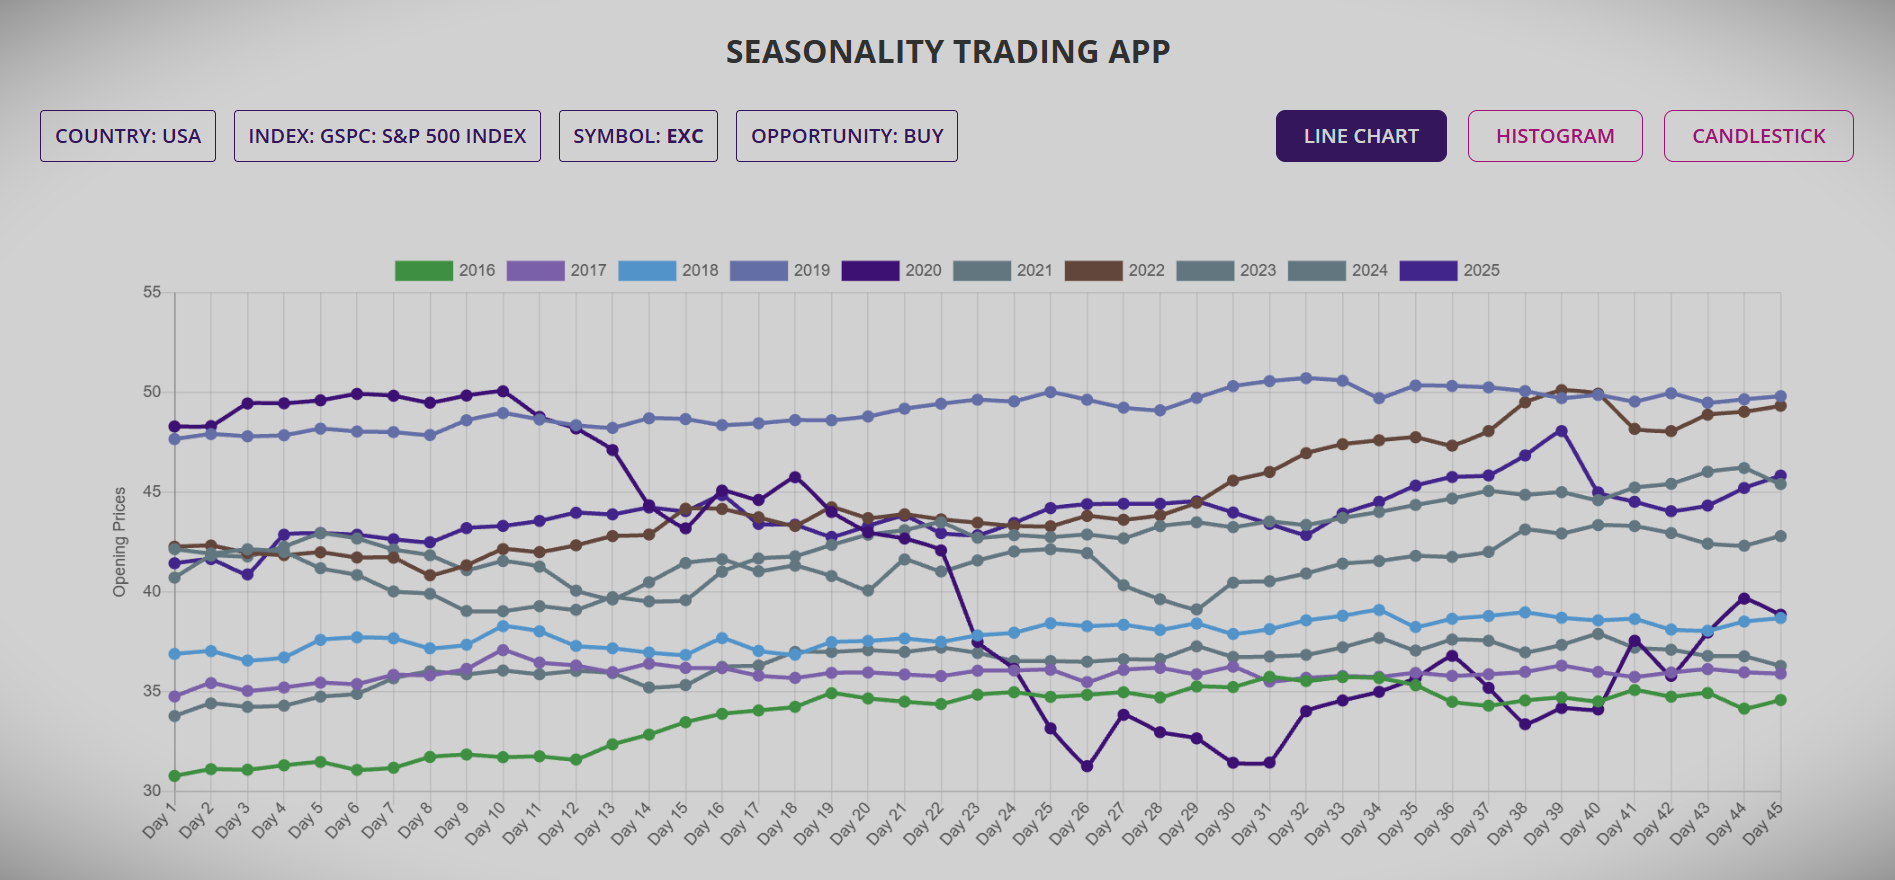
Further insights into the Seasonality pattern are available from a range of interactive charting options. The line chart provides a glimpse of how the price moved over the nine weeks observation period for all the years for the chosen Stock or ETF.
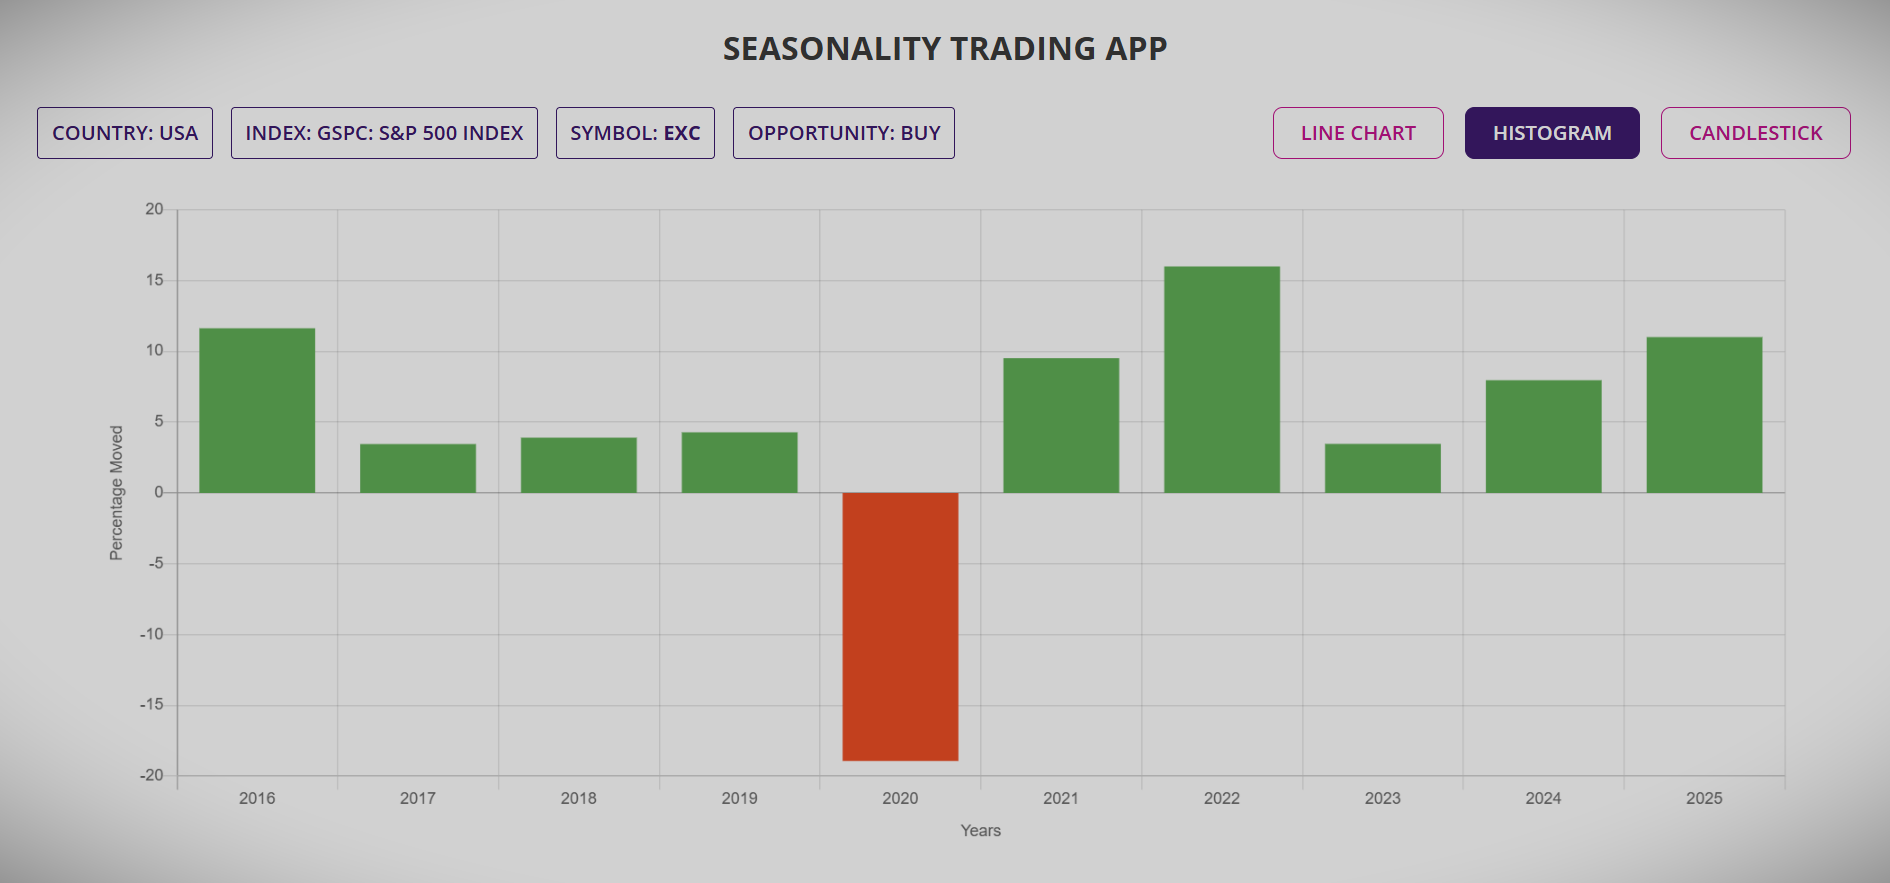
Histogram chart provides a snapshot of how much the underlying price moved in each of the years of observation.
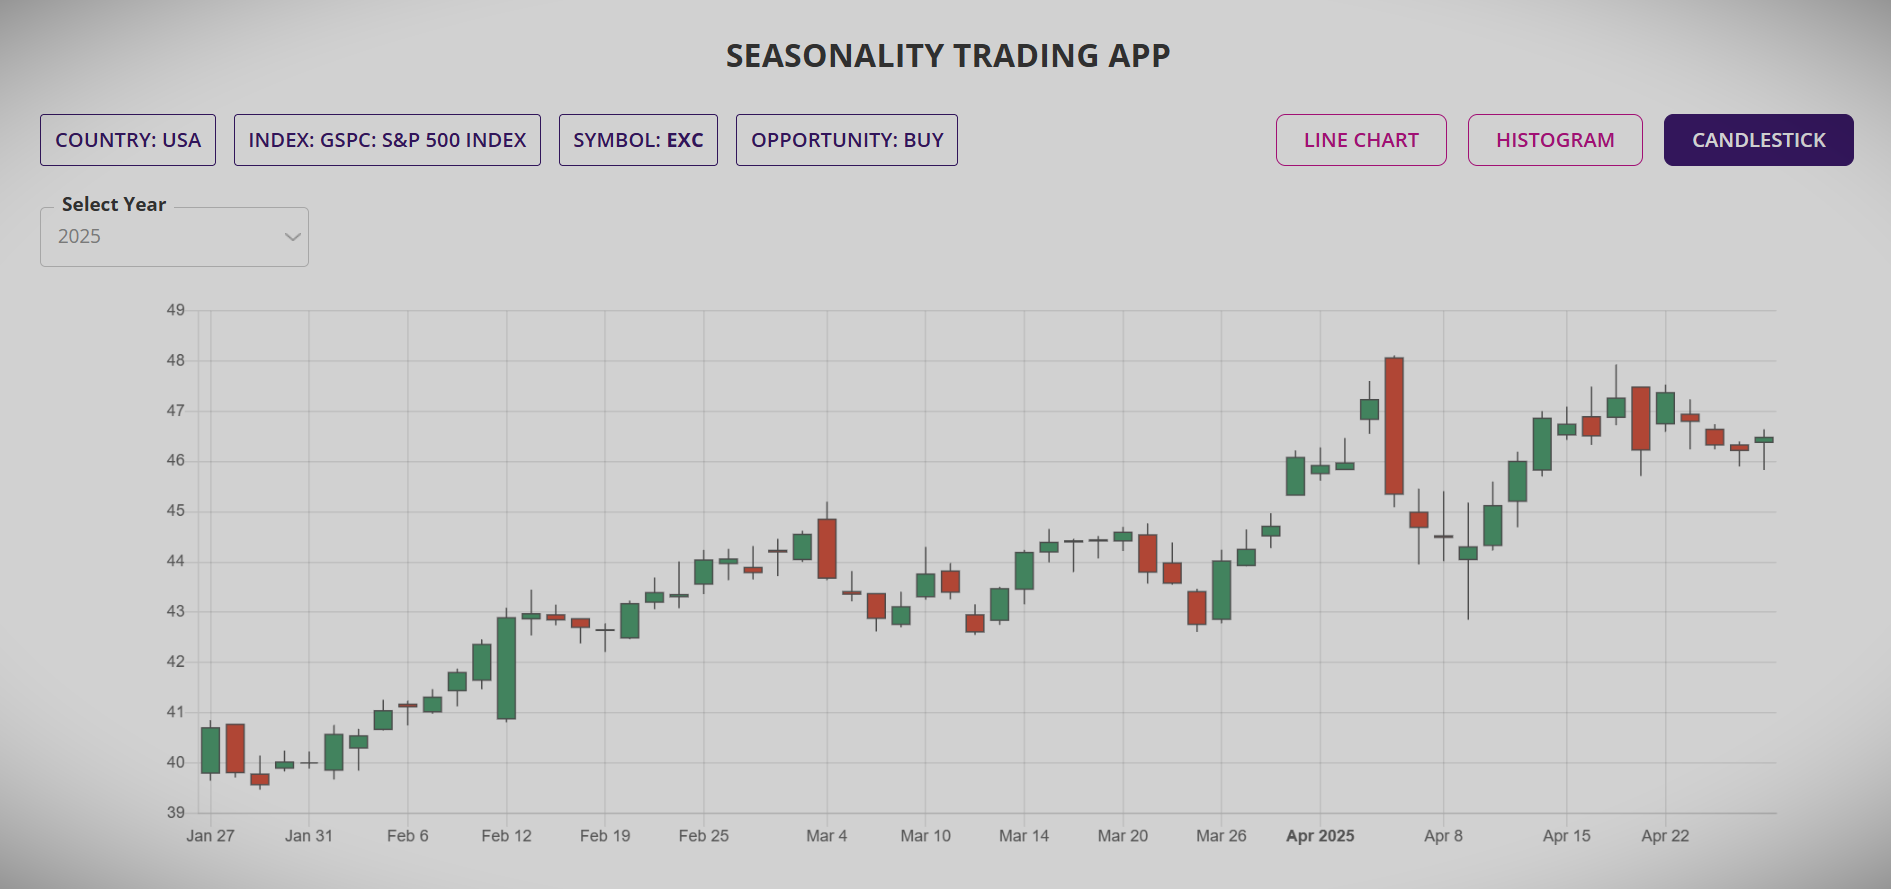
And finally, the candlestick chart of the underlying for the duration of the trade with two weeks before and after the observation period. The interactive chart allows to pick any year of choice from the years in history for which the app was run.
All these put together are designed to provide traders with the best insight possible so that well-informed decision could be made by the traders in terms of the probability and potential reward-risk ratio achievable in the trade.
How does Seasonality trading app work?
The Seasonality trading app uses a proprietary algorithm and leverages some of the most contemporary technologies to analyse billions of data points in the user selected Stock or ETF database to produce a summary report of all available Stocks and ETFs that meet the user input criteria.
With the advent of the cloud computing, data mining and powerful algorithm, it is now possible for the retail traders to have access to tools and apps which were earlier available only to large investment banks and hedge funds.
Which countries' Stocks & ETFs Seasonality trading app support?
Seasonality trading app is currently available for all the Stocks in the major Indices and ETFs of the following countries in four continents:
Asia: India, Singapore, Philippines, Japan, Hong Kong, Taiwan, Malaysia and China;
Europe: UK, Germany, France, Austria, Italy, Poland, Netherlands, Sweden, Switzerland, Spain, Portugal, Norway, Luxembourg, Ireland, Greece, Finland, Denmark and Belgium;
Oceania: Australia and New Zealand; and
The Americas: USA, Canada, Brazil, Chile, Mexico and Peru;
This makes up to about 45,000 Stocks and ETFs across 150 indices in more than 30 countries.
How to trade Seasonality?
Trading Seasonality is simple. Once the underlying Stock or ETF is selected from the summary and detailed report of the app, the underlying could be traded as it is, either in form of simple buy and sell or in form of derivatives such as buy and sell of CFDs or Options.
In countries where derivative trading is not allowed, traders may buy or sell the underlying Stock or ETF with strict profit and loss targets and let the trade play out. The trade may be closed once either of the targets are reached or may be managed by taking profit for half of holding of the underlying and let other half run with possibility for even higher profit.
Same principles may be used for CFD trading but with guaranteed stop to minimise the risk in the event of an adverse move of the underlying. For Options trading, it could be little complex as there are multiple ways in which the information could be traded, either as a single Option or as a portfolio of Option using two or three or four legs.
As always, for any trader, protection of trading capital is of paramount importance. So traders will always need to follow strict money management principles, allocate only a portion of capital in any trade and most-importantly, employ better than 2: 1 reward-risk ratio.
Watch the video in this page, go the video blog section to watch the tutorial on how to use the app or simply book a session, online or live, if you would like to know more about our Seasonality trading app.