What does a Volume Spike mean?
Daily trading volume of a Stock or ETF often goes un-noticed, yet, it carries some of the most valuable information for a trader. It is often an obscure piece of information in the technical chart of a Stock or ETF that is often not visible unless enabled by the user.
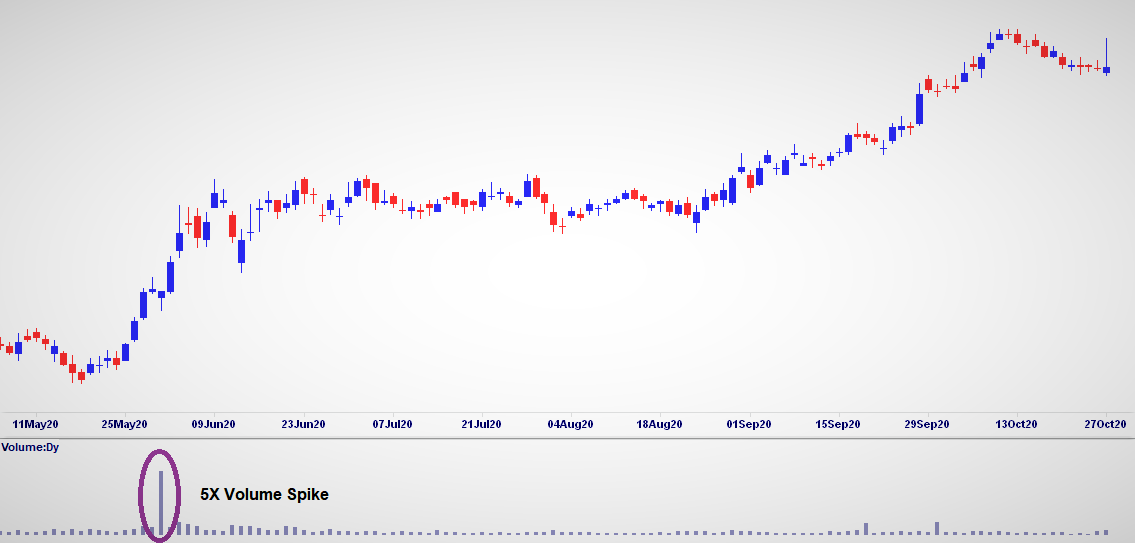
The section highlighted in the image above is what is the subject of interest. Daily trading volume of a Stock or ETF varies from one day to the other mainly because of the number of buyers and sellers in the market for that particular Stock or ETF. But, the key is to find out a sudden increase in trading volume in one day, compared to the average daily volume.
Although there is no industry standard definition of what increase in volume could be considered a spike, but a generally acceptable figure is anywhere between 3 to 10 times increase in one day volume compared to its daily average over a period of time is considered a volume spike.
Well, this sudden increase of trading volume or spike is one very important event for a trader to take advantage of while making trading decisions and there are very good reasons for that if you would like to put probability on your side.
Why is Volume Spike so important to traders?
A spike in trading volume is indicative of buying and selling frenzy and there could be two reasons for that. Large financial institutions or Smart money managers such as investment banks or large hedge funds or even very wealthy individuals have either bought the underlying Stock or ETF or the same institutions are selling off their holding. These two possible scenarios could have one of the three possible downstream implications in terms of the movement of the underlying Stock or ETF.
- UP: the underlying Stock or ETF could go up if the volume spike is caused by buying frenzy by the institutional investors as they anticipate increased performance of the company;
- DOWN: the underlying Stock or ETF could go down if the institutional investors are off-loading their holding either because of profit taking or in anticipation of poor performance of the underlying stock;
- SIDEWAYS: the underlying Stock or ETF price could trade in a narrow range with no significant move in either direction
Just knowing the existence of a volume spike is not good enough but to know what is the likelihood of the underlying to go UP or DOWN following a volume spike. How about knowing the complete historical performance of past Volume spikes of all Stocks and ETFs and finding out how many times those spikes were followed by large moves, the size of the moves and number of trading days it took to get to those levels?
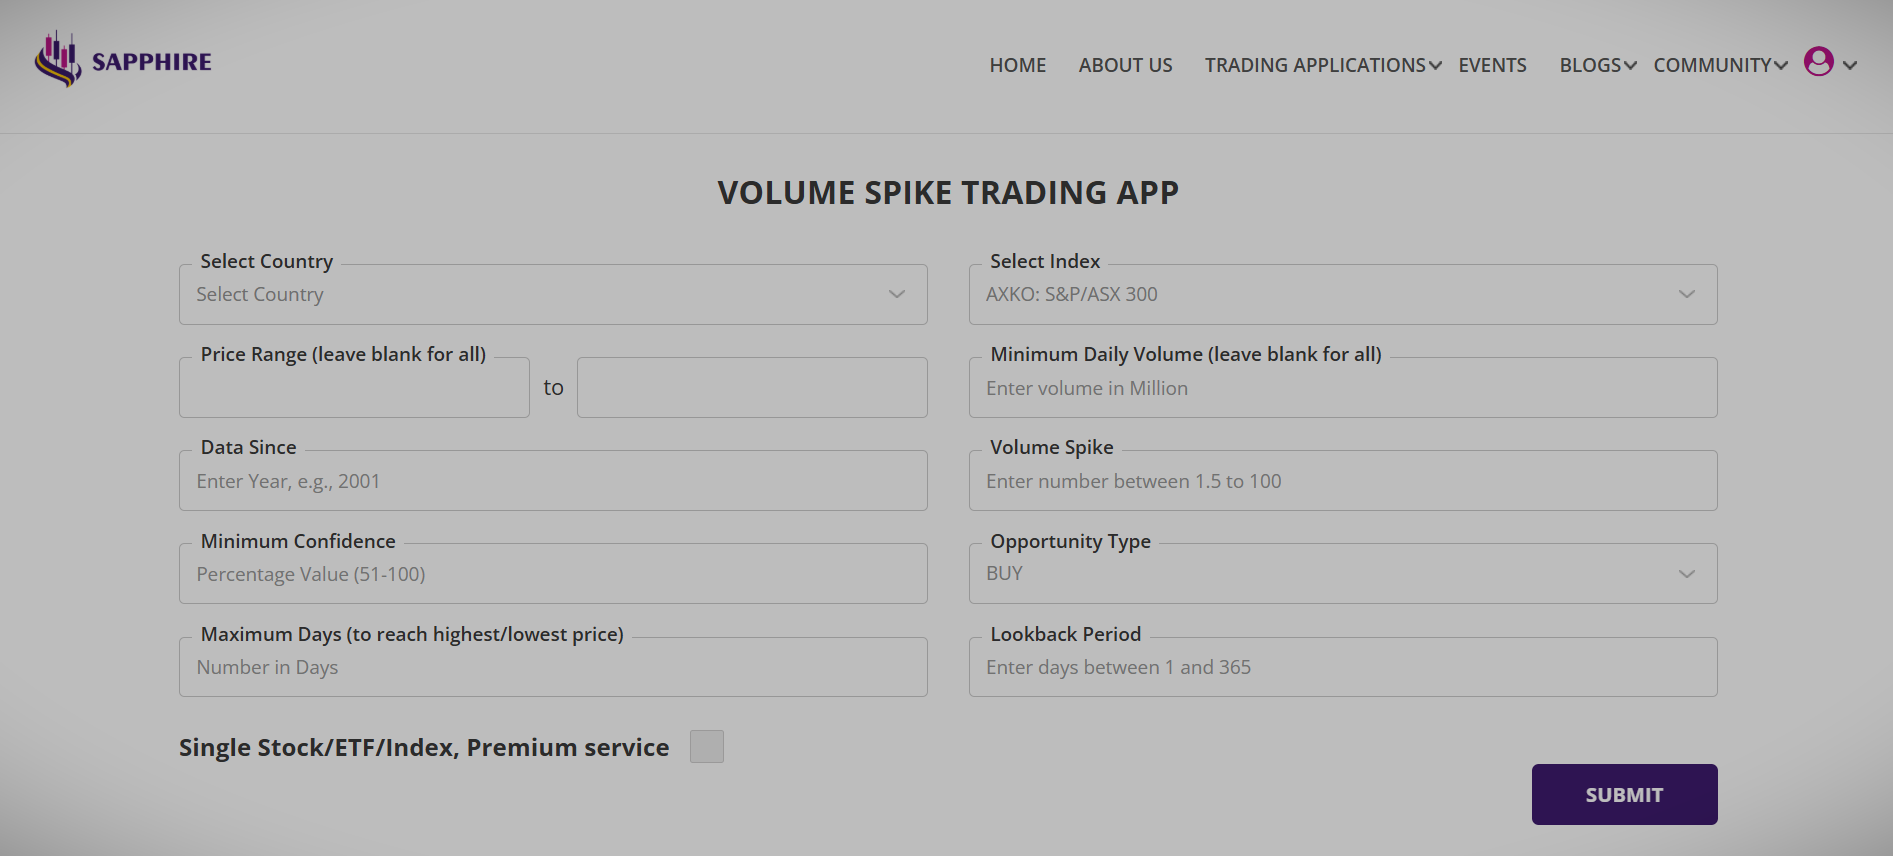
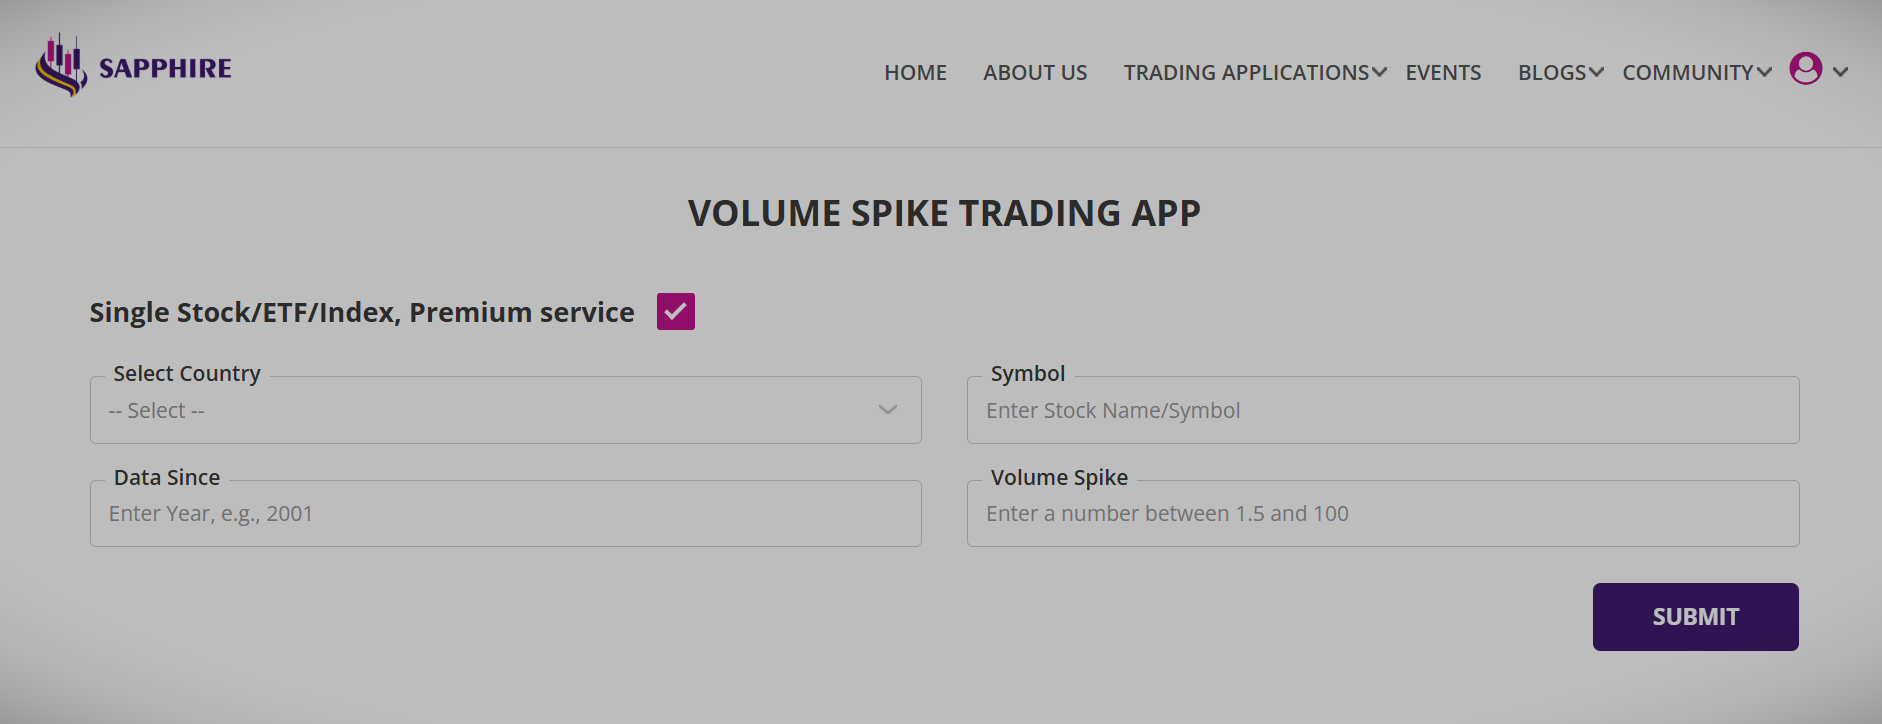
Our Volume spike trading app offers different ways to investigate whether a volume spike had happened in any of the Stocks in an index or the whole list of ETFs in a country to analyse all the parameters around those volume spikes or investigate one single Stock or ETF for historical performance via Premium service.
That is where the data mining and analytics come into play and our Volume Spike app does exactly that and some more. Here are few examples of what usually follows a spike in trading volume, found out by our Volume Spike app:
- 3X Spike in average daily trading volume of Boral Ltd (ASX: BLD) followed a surge in the stock price of over 10% in next 15 trading days, with 90% confidence in last 5 years;
- 4X Spike in daily trading volume of Alphabet Inc. (NASDAQ: GOOG) followed over 6.7% decrease in stock price in next 30 trading days, with 80% confidence in last 5 years;
- 4X Spike in trading volume of Eicher Motors Ltd. (NSE: EICHERMOT) followed a surge in Stock price of over 14% in the following 39 days with 83% confidence in last 5 years
This confidence is what is the key to traders for making the trading decision of the underlying. Confidence is calculated as percentage of the number of times the underlying moved in the desired direction, after the volume spike, out of the total number of spikes occurring over the number of years.
Confidence translates into probability; if the spike followed a large move 90% of the time in past, that means there is 90% probability of the underlying Stock or ETF of making similar large move when the next volume spike of that size occurs in future. This is the scientific way of making trading decision based on hard evidences from the past and not based on hunch.
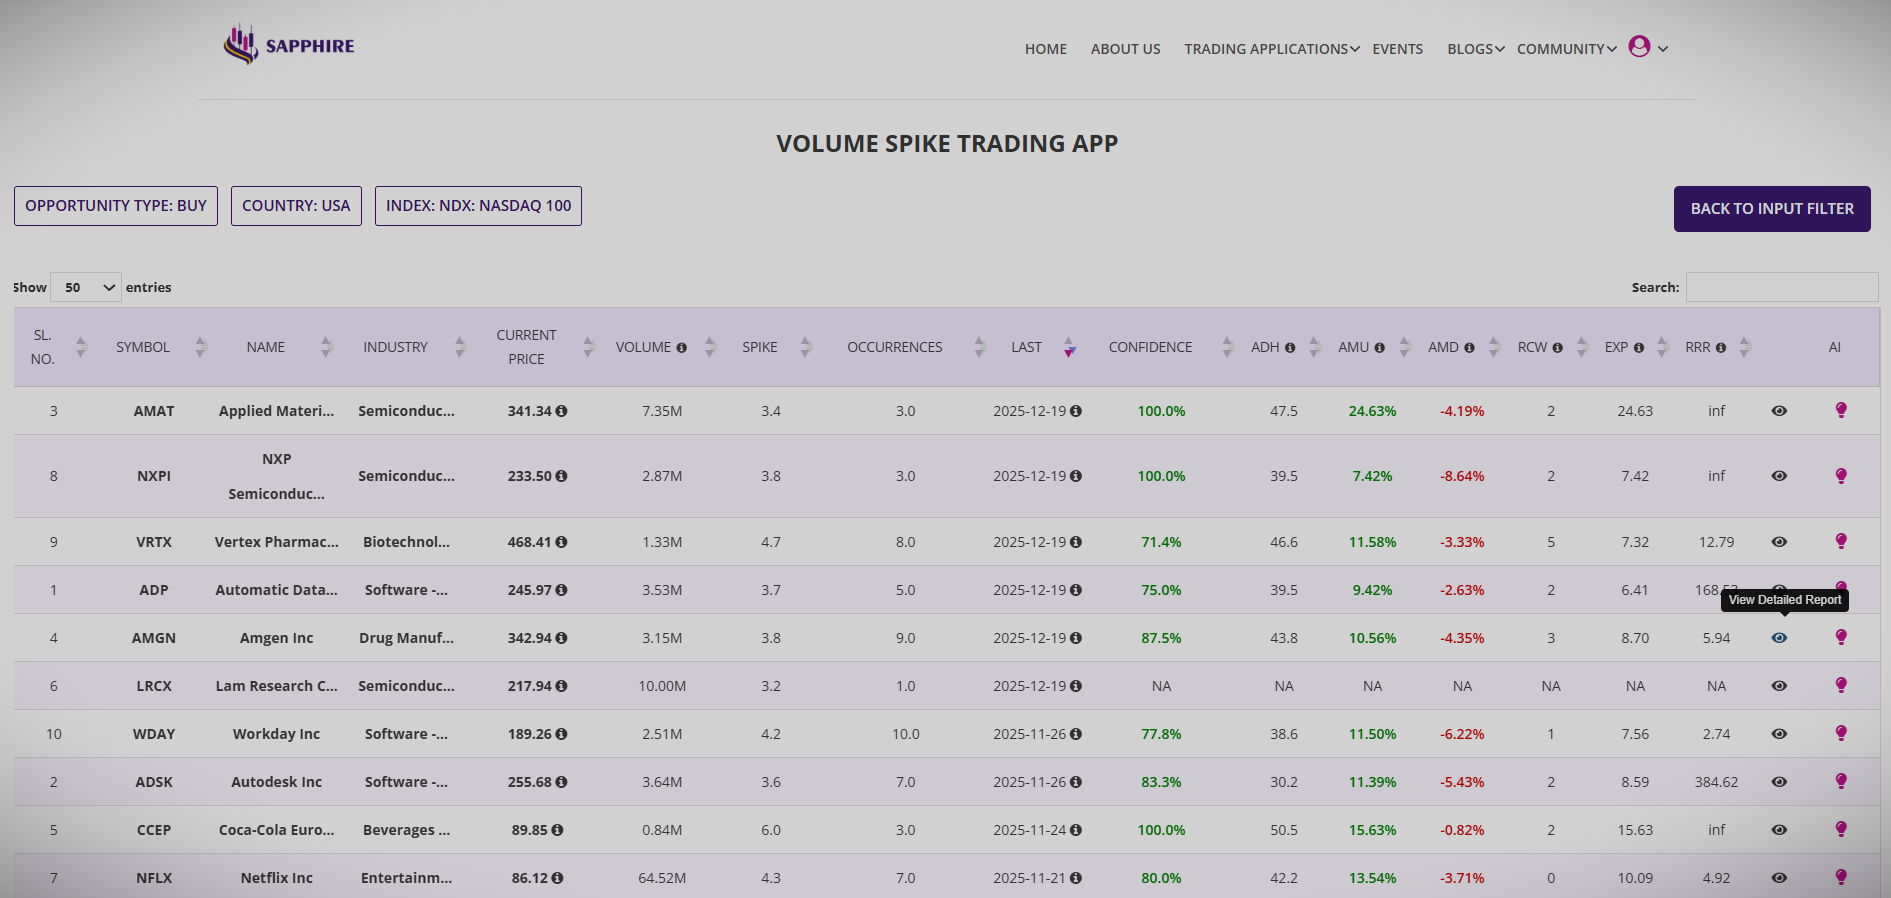
Summary report provides the whole list of underlying Stock of ETF that had volume spikes of the size requested within last chosen number of days and report those for the period in data since.
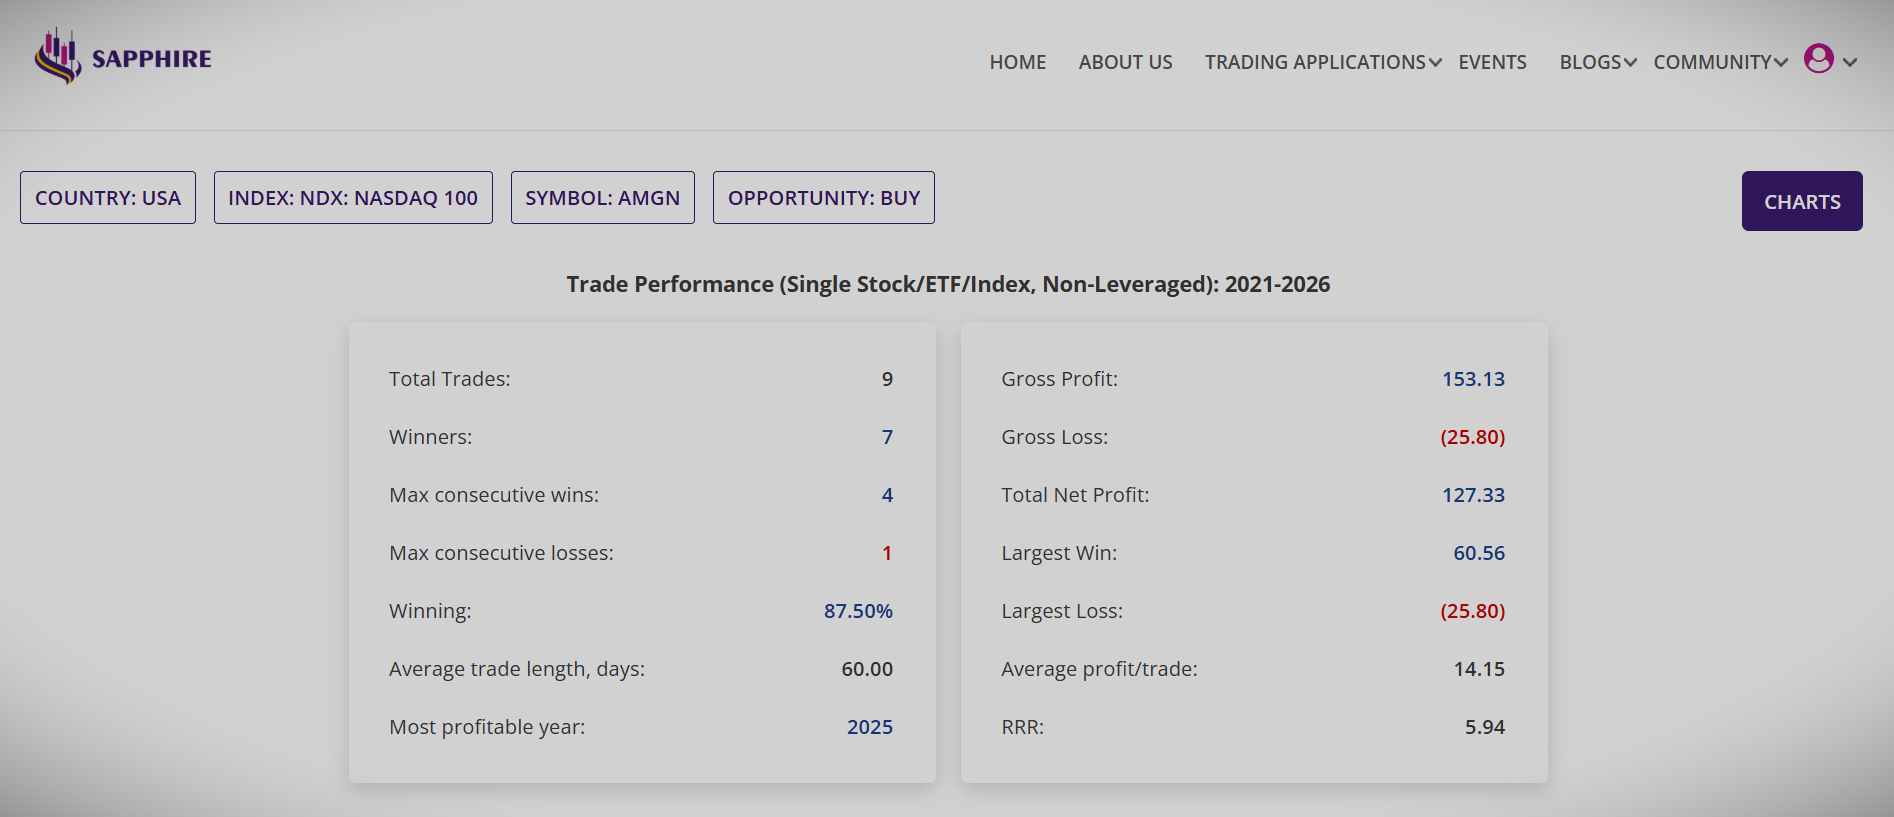
Detailed report breaks down each line of the summary reports into further details providing insight into each of those underlying Stock or ETF’s past overall performance including all the volume spikes that had occurred for the number of years of interest.
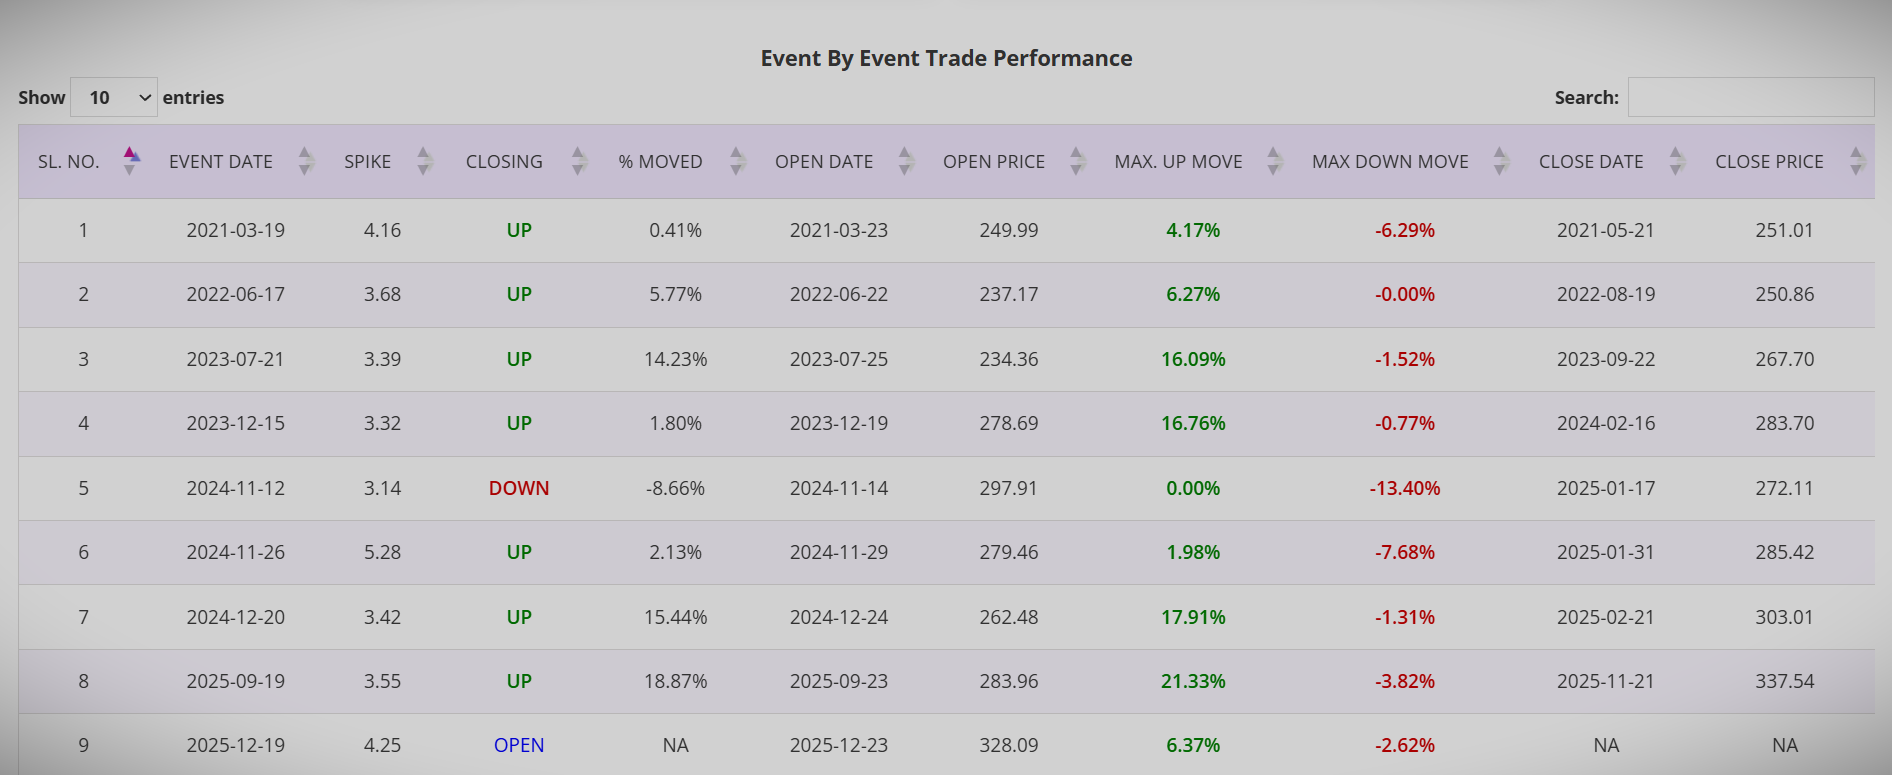
The detailed report also provide further insight for each occurrence of the volume spike in terms of the date of occurrence, the maximum move up, maximum move down, the number of days it took to reach those highs and lows.
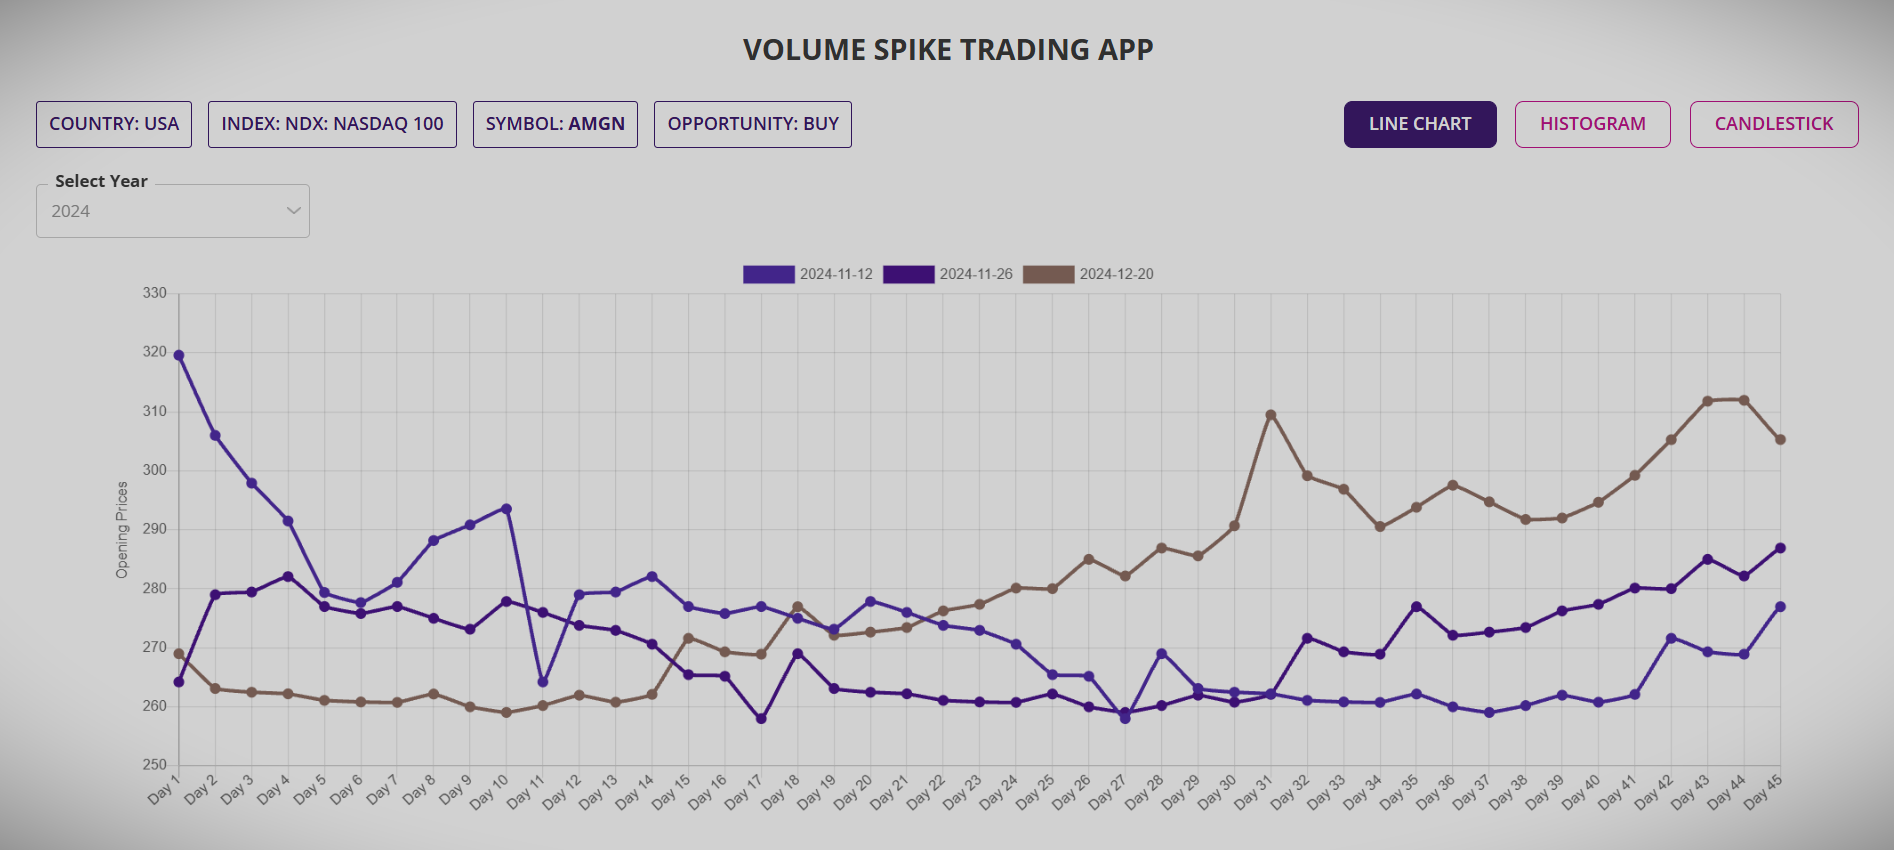
The accompanied charting functions provide visual insights of all the key parameters in the detailed report. There are three charting option available. The line chart provides event by event price movement for each trade for nine week period for each year of the analysis.
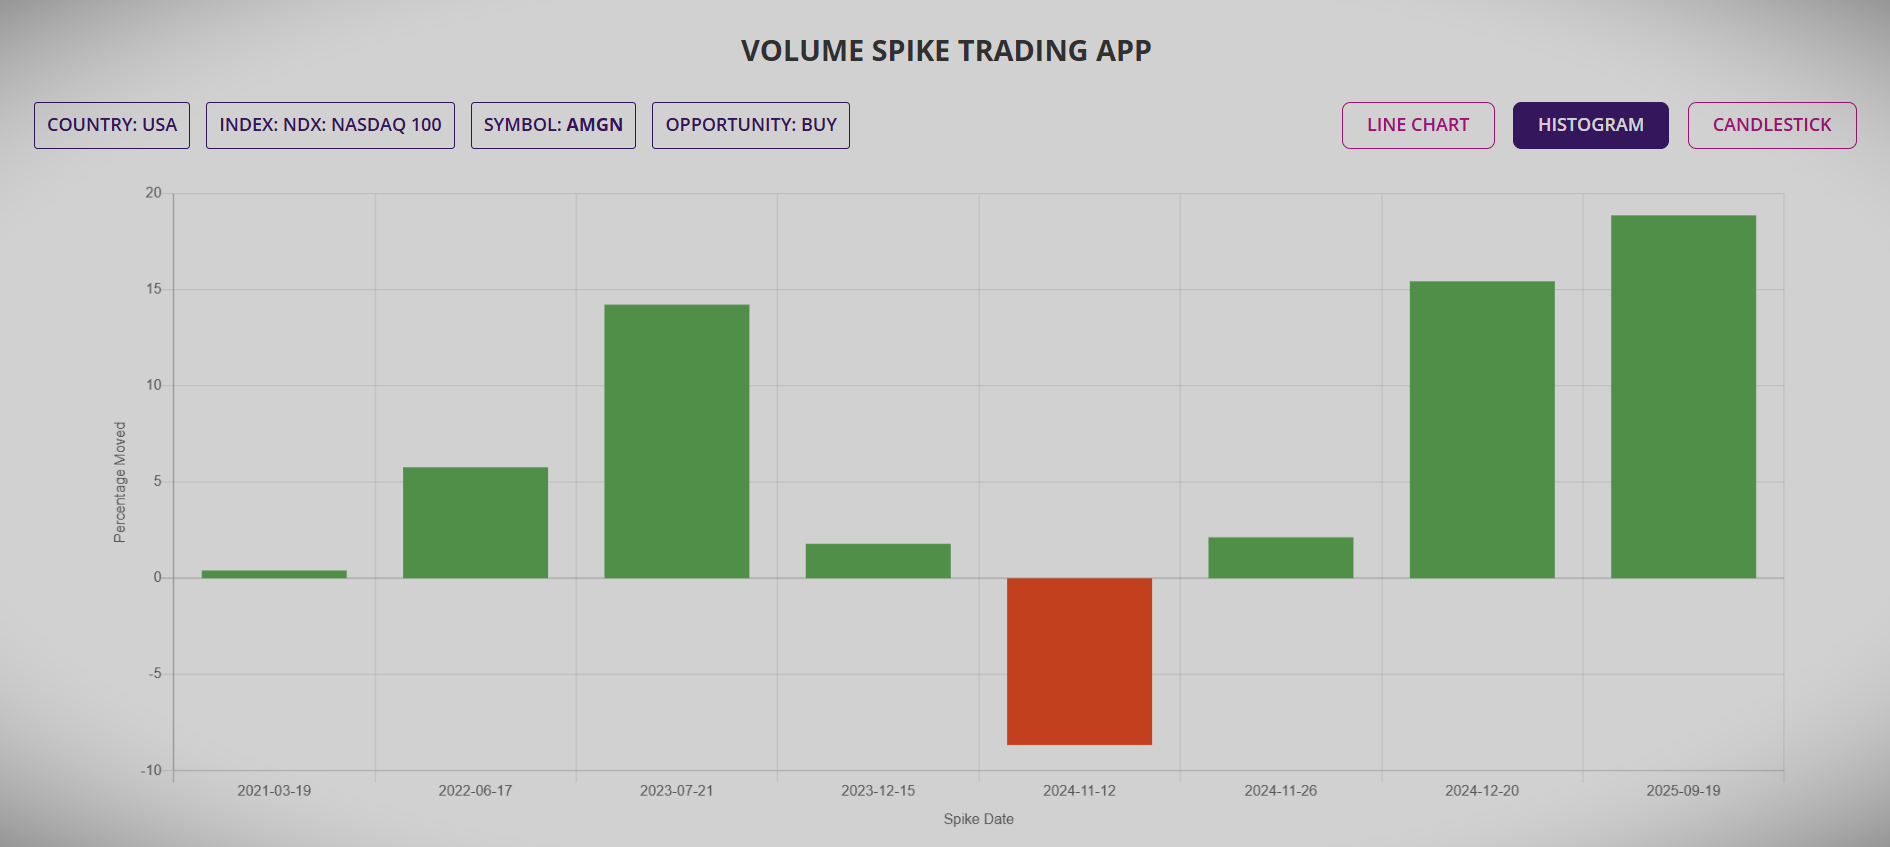
The histogram provides the glimpse of all past spikes and the size of the moves in one succinct chart.
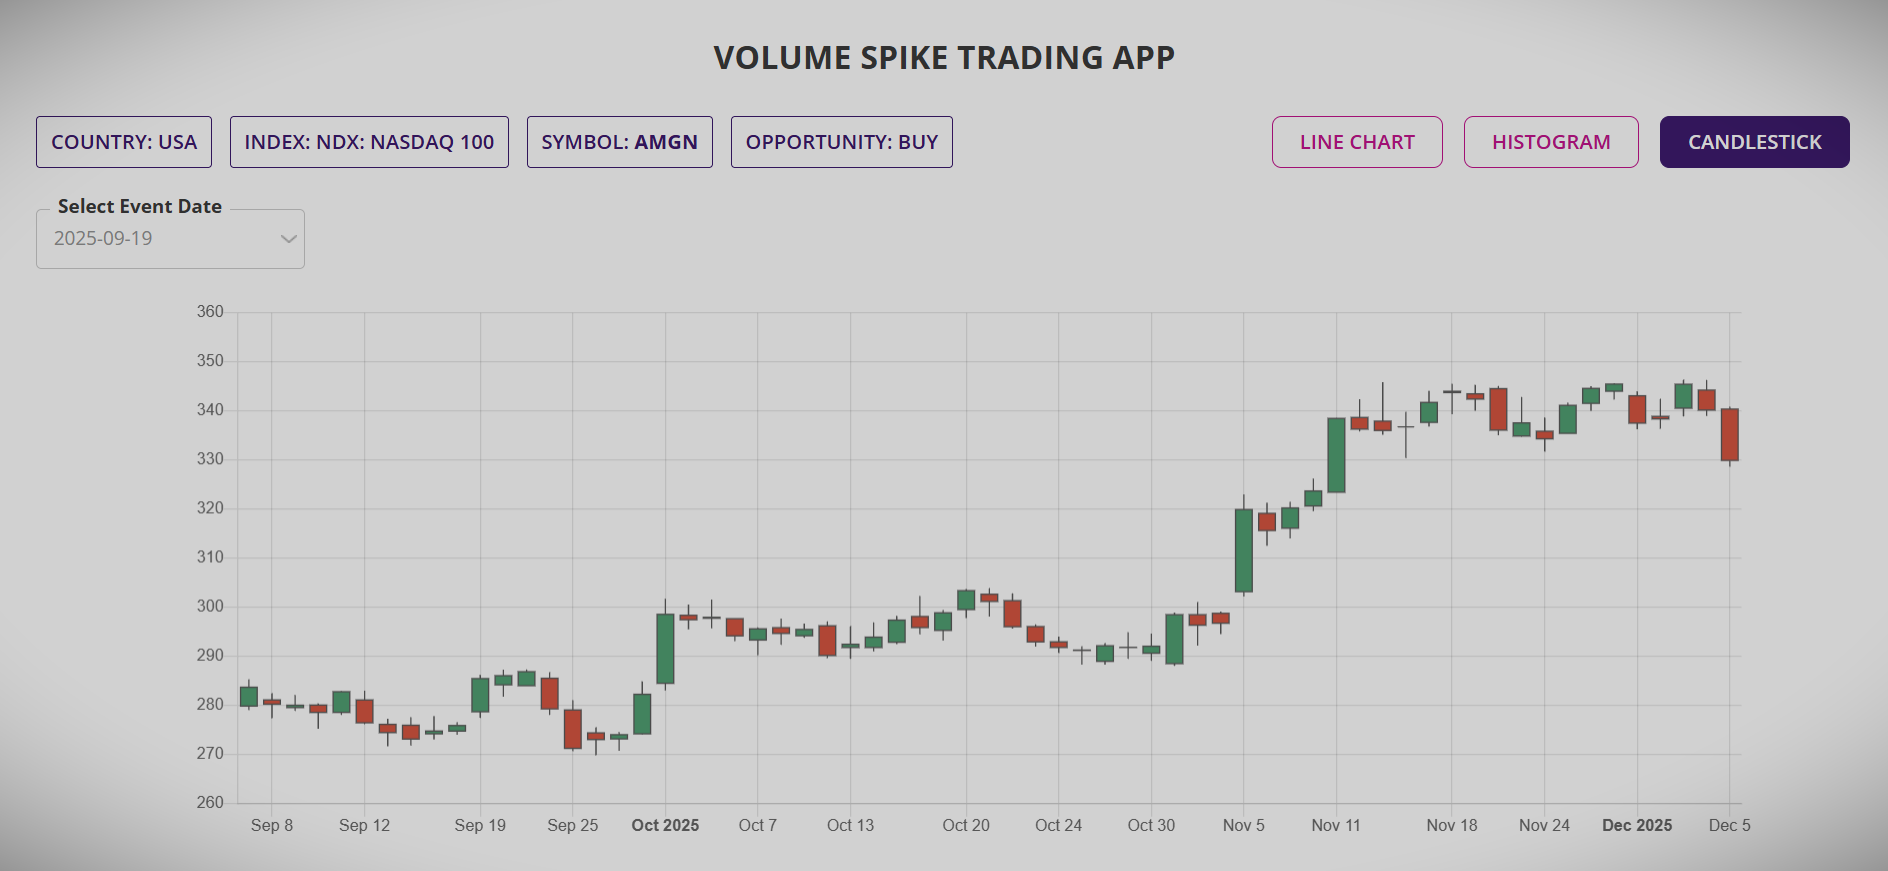
And finally, the candlestick chart for those traders who rely on charting tools for trading decisions. The candlestick charts shows the two weeks leading to the volume spike, followed by eleven weeks of candlesticks charting for clear visual display of the trajectory the underlying Stock or ETF had taken following the volume spike.
How does Volume Spike trading app work?
Our Volume spike trading app uses a proprietary algorithm to identify the volume spike and the price action that follows the spike, in order to calculate all the parameters of interest to the trader. The app analyses billions of data points from across the stock database for the country and the index selected and leverages some of the most sophisticated technologies available today to provide these detailed insight about the Stocks or ETFs following a Volume spike.
With the advent of the cloud computing, data mining and powerful algorithm, it is now possible for the trading community in general to have access to tools and app which were earlier available only to investment banks and large hedge funds.
Which countries' Stocks and ETFs does the Volume Spike app support?
Volume Spike app is currently available for all the Stocks in the major Indices and ETFs of the following countries in four continents:
- Asia: India, Singapore, Philippines, Japan, Hong Kong, Taiwan, Malaysia and China
- Europe: UK, Germany, France, Austria, Italy, Poland, Netherlands, Sweden, Switzerland, Spain, Portugal, Norway, Luxembourg, Ireland, Greece, Finland, Denmark and Belgium
- Oceania: Australia and New Zealand
- The Americas: USA, Canada, Brazil, Chile, Mexico and Peru
This makes up to about 45,000 Stocks and ETFs across 150 indices in more than 36 countries.
How to trade Volume Spike?
Once the underlying Stock or ETF is selected from the summary and detailed report of the app, the underlying could be traded as it is, either in form of simple buy and sell or in form of derivatives such as buy and sell of CFDs or Options.
In countries where derivative trading is not allowed, traders may buy or sell the underlying Stock or ETF with strict profit and loss targets and let the trade play out. The trade may be closed once either of the targets are reached or may be managed by taking profit for half of holding of the underlying and let other half run with possibility for even higher profit.
Same principles may be used for CFD trading but with guaranteed stop to minimise the risk in the event of an adverse move of the underlying. For Options trading, it could be little complex as there are multiple ways in which the information could be traded, either as a single Option or as a portfolio of Option using two three or four legs.
As always, for any trader, protection of trading capital is of paramount importance. So traders will always need to follow strict money management principles, allocate only a portion of capital in any trade and most-importantly, employ better than 2: 1 reward-risk ratio.
Watch the video in this page, go the video blog section to watch the tutorial on how to use the app or simply book a session, online or live, if you would like to know more about our Volume spike trading app.