
-
 Admin123 :
Admin - Sapphire Capitals
Admin123 :
Admin - Sapphire Capitals -
 Date :
2023-05-28
Date :
2023-05-28
Stock of interest - Week 22 (2023) – AUSTRALIA – PRICE ACTION TRADING STRATEGY
The week beginning Monday, the 29th May is Week 22 as per ISO numbering convention of the weeks of a year.
Country in focus:
This week we look at the Stocks from Australia in its ASX200 index. The S&P/ASX 200 index is a market-capitalization weighted and float-adjusted stock market index of stocks listed on the Australian Securities Exchange. The index is maintained by Standard & Poor's and is considered the benchmark for Australian equity performance. It is based on the 200 largest ASX listed stocks, which together account for about 82% Australia's share market capitalization.
Stock/ETF in focus:
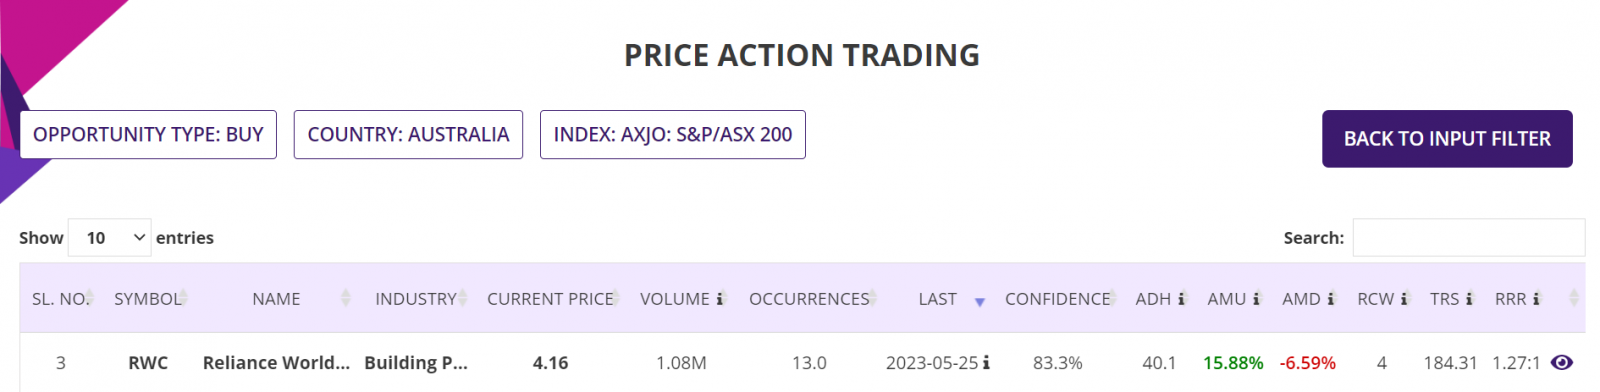
Specific Stock in focus is Reliance Worldwide Corporation Limited (Ticker: RWC). The trading currency is Australian Dollars or AUD.
Trade Direction:
BULLISH, Price Action study since 2020 reveal 83.3% probability of success with historical worst-case RRR of over 1.27:1 in all completed BUY (LONG) trades.
Most Recent Event: Most recent Price Action event was on Thursday, the 25th May. Preferred trade opening is the next market open day on Friday, the 26th May but since the blog is being published only in weekend, so we are providing the information as such so you know how to trade such opportunities as and when a Price action event occurs.
Overview:
Reliance Worldwide Corporation Limited, together with its subsidiaries, engages in the design, manufacture, and supply of water flow, control, and monitoring products and solutions for plumbing and heating industries. Reliance Worldwide Corporation Limited was founded in 1949 and is headquartered in Atlanta, Georgia.
The company offers push-to-connect plumbing fittings for the installation and repair of water reticulation systems; crimp fittings, expansion fittings, and accessories; coiled and straight length tubing; polybutylene pipe for domestic water and central heating systems; LLDPE tubing for fluid control applications; and rigid nylon and aluminium piping for air and pneumatic systems. The company also provides temperature and pressure relief, pressure regulation, and thermostatic mixing valves; push-to-connect technologies for drink dispense, pure water, air and pneumatics, blown fibre, automotive, and OEM solutions; and plumbing and mechanical solutions that support the delivery of water and firestop solutions. In addition, it offers other products, such as backflow preventers, expansion vessels, underfloor heating components and kit systems, water meters, and water mains connection fittings, repair sleeves, as well as appliance, and water and gas connectors. The company provides its products under the SharkBite, JG Speedfit, HoldRite, CashAcme, Reliance Valves, MultiSafe, and John Guest brands. It operates in Australia, New Zealand, Korea, China, the United States, Canada, the United Kingdom, Spain, Italy, Germany, France, the Czech Republic, and Poland.
(Courtesy: Yahoo Finance)
Sector and Industry Details:
Sector(s): Industrials
Industry: Building Products & Equipment
Full Time Employees: More than 2,800
(Courtesy: Yahoo Finance)
Fundamentals:
52 Week Range 2.8000 - 4.6850
Avg. Volume 2,396,774
Market Cap 3.287B
PE Ratio (TTM) 15.41
EPS (TTM) 0.2700
Earnings Date Aug 21, 2023
Ex-Dividend Date Mar 09, 2023
(Courtesy: Yahoo Finance)
Current trading price:
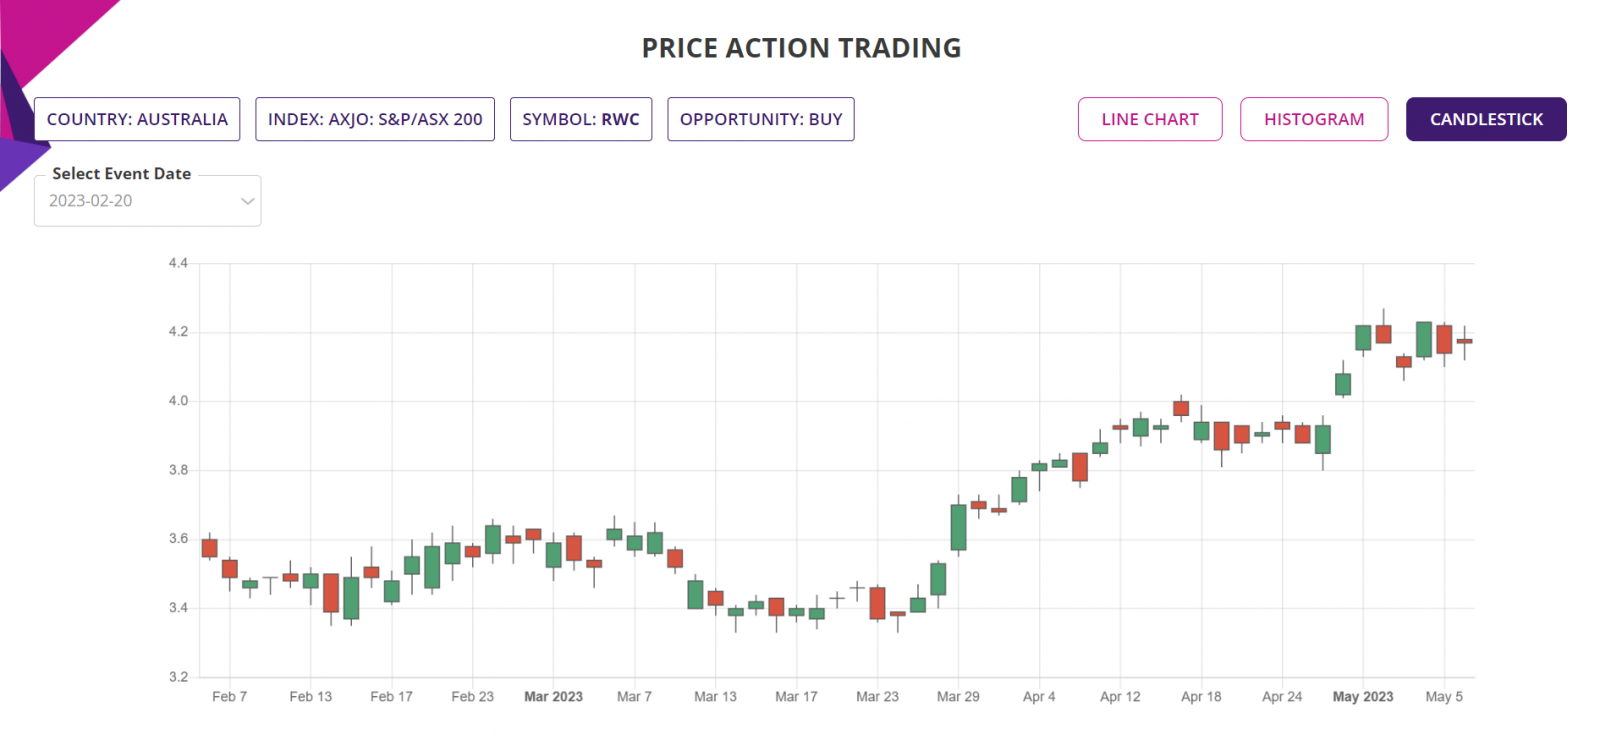
As of Thursday, the 25th May 2023, or the day the Price Action event took place, the stock closed at 4.19. The last closing price on Friday, the 26th May was 4.16.
PRICE ACTION:
The Stock was Bullish 83.3% of the time following Bullish Price action events since the beginning of 2020. Here is the key Price Action event performance of the Stock:
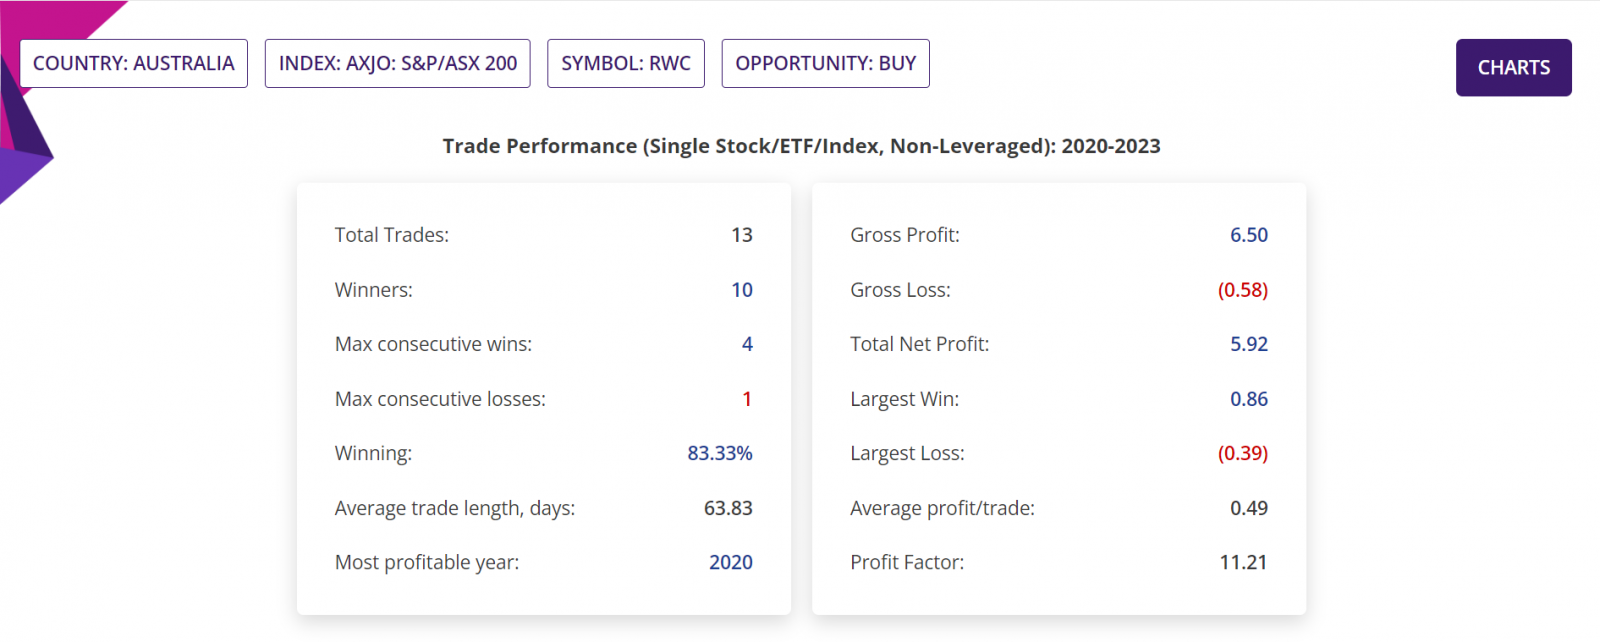
Summary report: Since beginning of 2020, there were 13 BULLISH Price action events, of which one event is yet to be traded, that is the current Bullish trading opportunity being discussed in this blogpost. These leaves 12 completed trades, of which 10 were winners (and hence 83.3% confidence or Probability) with average move up (AMU) of 15.88% and average move down (AMD) of 6.59% for an average holding time (ADH) of about 40 days.
Historical RRR in those completed trades was 1.27:1. Please note that RRR shown here is a worst-case scenario, as many trades could be closed sooner with higher profit compared to trades closed at the end of 9-week period.
Detailed Report, Trade Performance: If 10,000 stocks were bought following those BULLISH Price action events, then a trader would have had a Gross Profit of 65,000, Gross Loss of 5,800, making a Total Net Profit of 59,200. In those closed trades, the Largest Win was 8,600, Largest Loss is 3,900, the Average profit/trade being 4,900. All figures above are in Australia Dollars.
The Profit Factor (which is quotient of Gross Profit and Gross Loss) in those trades was a whopping 11.21.
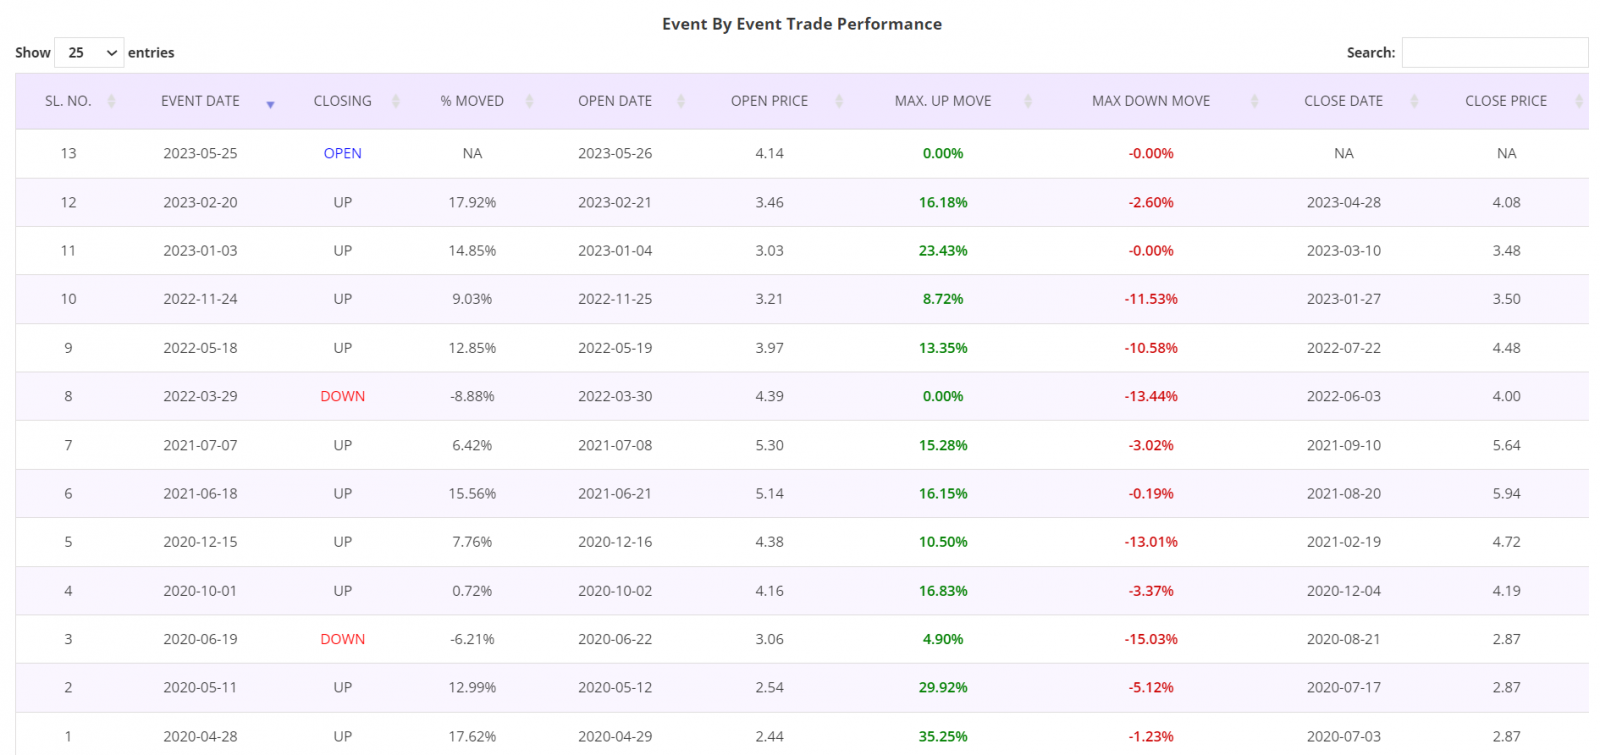
Detailed Report, Trade by Trade Performance: Results of each trade taken following the Price Action events since the beginning of 2020 are as shown in the table below. As can been seen in the table, 10 trades were winners and two losers out of total of 13 trades. These tables are from the Detailed report of the Price Action trading app.
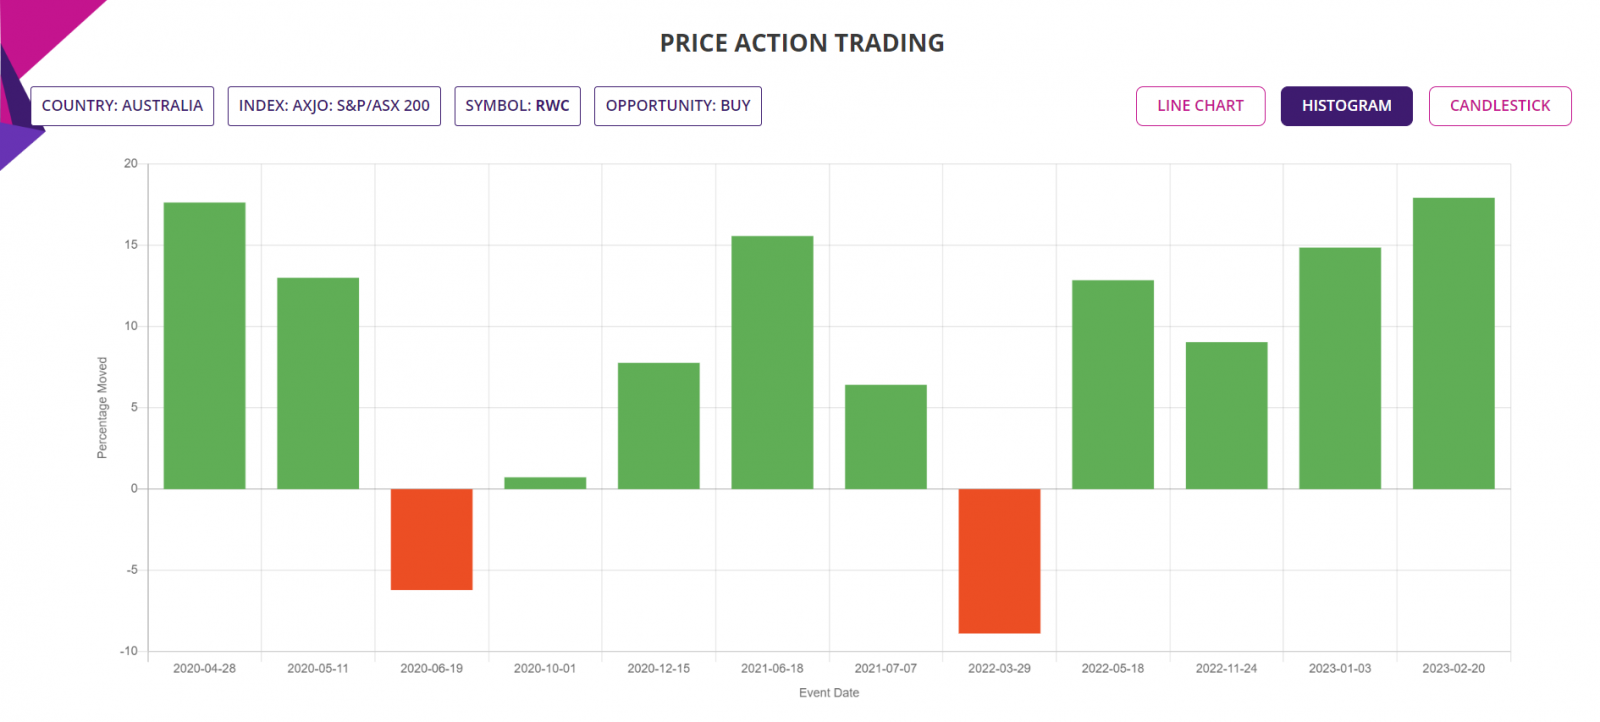
Histogram Chart: The chart below shows the percentage moves of the underlying Stock of Interest following each Price Action event for the period of analysis mentioned earlier, for a quick visual clue of the trade-by-trade performance.
Candlestick Chart: The candlestick chart of the underlying Stock/ETF’s latest performance is as shown below. In the web-based Price Action trading app, the chart is available for all the price action events since the year in the “Data since” in the input filter page.
Trade Structure:
If we had traded the Stock this week, then we would have structured the trade as follows, using CFD:
|
TRADE STRUCTURE (All prices in Australian Dollars or AUD) |
||
|
Stock price |
$4.16 |
Assuming Stock open on Monday at that price and trade placed at opening |
|
CFDs |
10,000 |
Number of Stocks used for this CFD trade |
|
CFD Margin |
10% |
CFD leverage |
|
|
|
|
|
Margin |
$4,160 |
Amount of fund required for the trade |
|
|
|
|
|
Target Stock price |
$4.78 |
15% above the current price, limit order placed at this underlying price |
|
Stop Stock price |
$3.87 |
7% below the current price, guaranteed stop at this price |
|
|
|
|
|
Profit Target |
$6,240 |
|
|
Stop Loss |
$2,912 |
|
|
RRR |
2.14 |
|
|
RoI |
150% |
Return on investment, not accounting for any commission or CFD interest |
The choice of RRR of 2.14:1 is on the higher side of the average of last 12 completed trades following the Price Action events since 2020 till date. Please note that the RoI mentioned above does not include any transaction costs such as broker commissions and CFD interest payable during the period the position is held. 10% leverage is assumed for CFD trade, but please check with your broker if they allow to trade CFD and what is the leverage allowed if CFD trade is available. CFD leverage varies from underlying to underlying, please check with your broker.
Further Information about trading applications:
Please visit the following URL for more information on various trading applications from Sapphire Capitals which are designed to deliver high probability trading opportunities for swing trading as well as for intraday trading:
https://www.sapphirecapitals.com/pages/swing-trading-stock-seasonality-strategy/
https://www.sapphirecapitals.com/pages/swing-trading-stock-price-action-strategy/
https://www.sapphirecapitals.com/pages/swing-trading-volume-spike-stock-trading-strategy/
https://www.sapphirecapitals.com/pages/day-trading-intraday-seasonality-trading/
Disclaimer:
Sapphire Private Assets (ABN: 34 613 892 023, trading as Sapphire Capitals) is not a broker or a financial adviser but an education and research organisation; we provide training and tools for traders and DIY fund managers for trading in global financial markets. The contents of the blog have been produced by using technical analysis and trading applications developed by Sapphire Capitals for the Stock and ETF traded worldwide. The contents of this blog are intended for education and research purposes only and is not a recommendation or solicitation to invest in any Stock or ETF.
For more details, please visit www.sapphirecapitals.com/Disclaimer.


