
-
 Admin123 :
Admin - Sapphire Capitals
Admin123 :
Admin - Sapphire Capitals -
 Date :
2023-05-07
Date :
2023-05-07
Stock of interest - Week 19 (2023) – SINGAPORE – PRICE ACTION TRADING STRATEGY
The week beginning Monday, the 8th May is Week 19 as per ISO numbering convention of the weeks of a year.
Country in focus:
This week we look at the Stocks from SINGAPORE in FTSE STRAITS TIMES SINGAPORE index. The index is a capitalisation-weighted measurement stock market index that is regarded as the benchmark index for the stock market in Singapore. It tracks the performance of the top 30 companies that are listed on the Singapore Exchange (SGX).
Stock/ETF in focus:
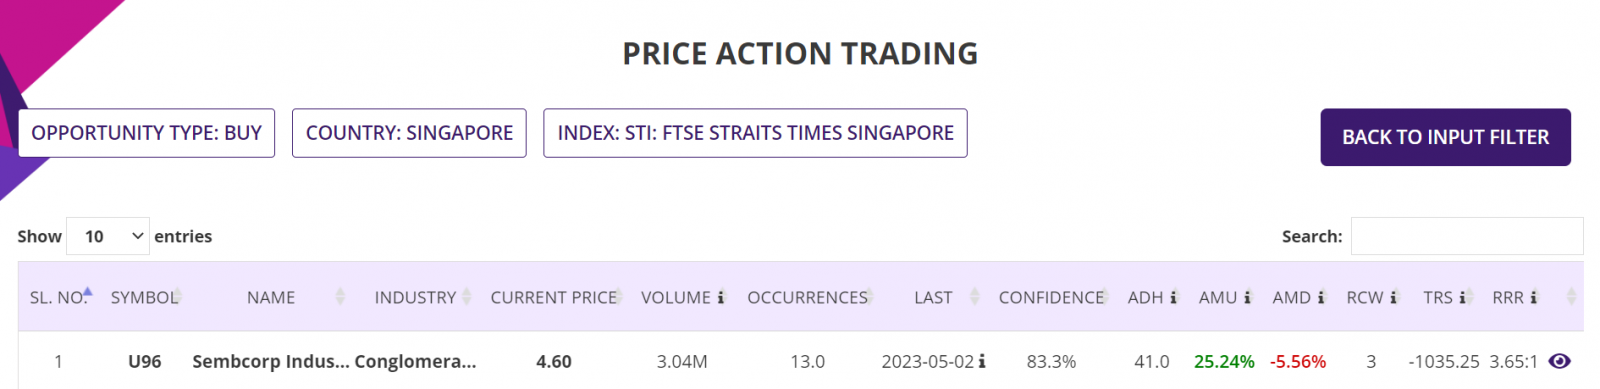
Specific Stock in focus is Sembcorp Industries Ltd (Ticker: U96). The trading currency is Singapore Dollars or SGD.
Trade Direction:
BULLISH, Price Action study since 2020 reveal 83.3% probability of success with historical worst-case RRR of over 3.65:1 in all completed BUY (LONG) trades.
Most Recent Event: Most recent Price Action event was on Tuesday, the 2nd May. Preferred trade opening is the next market open day on Wednesday, the 3rd May but since the blog is being published only in weekend, so we are providing the information as such so you know how to trade such opportunities as and when a Price action event occurs.
Overview:
Sembcorp Industries Ltd, an investment holding company, engages in the renewables, integrated urban solutions, conventional energy, and other businesses in Singapore, the United Kingdom, China, India, rest of Asia, the Middle East, and internationally. Sembcorp Industries Ltd was incorporated in 1998 and is headquartered in Singapore.
The company operates through four segments: Renewables, Integrated Urban Solutions, Conventional Energy, and Other Businesses and Corporate. The Renewables segment provides electricity from solar and wind resources and energy storage solutions, as well as system services that support integration of renewables into grid; and trades in energy attribute certificates. This segment also includes the development and provision of installation, operation, and maintenance of solar, wind, and energy storage assets. The Integrated Urban Solutions segment develops large-scale integrated urban and integrated townships, such as industrial parks, business, commercial and residential spaces, and production and reclamation of water and industrial wastewater treatment, as well as solid waste management and waste-to-resource solutions. This segment also comprises carbon capture, utilization, and storage projects. The Conventional Energy segment sells energy molecules, including natural gas, steam, and electricity from various fossil fuels, such as natural gas and coal. This segment also sells water products from its integrated assets. It also engages in the construction and engineering related activities; and insurance and financial services. The company was formerly known as Minaret Limited and changed its name to Sembcorp Industries Ltd in July 1998.
(Courtesy: Yahoo Finance)
Sector and Industry Details:
Sector(s): Industrials
Industry: Conglomerates
Full Time Employees: 5,619
(Courtesy: Yahoo Finance)
Fundamentals:
52 Week Range 2.7000 - 4.6700
Avg. Volume 4,109,586
Market Cap 8.177B
PE Ratio (TTM) 11.74
EPS (TTM) 0.3900
Earnings Date Aug 03, 2023 - Aug 07, 2023
Ex-Dividend Date Apr 25, 2023
(Courtesy: Yahoo Finance)
Current trading price:
As of Thursday, the 2nd May 2023, or the day the Price Action event took place, the stock closed at 4.33. The last closing price on Friday, the 5th May was 4.58.
PRICE ACTION:
The Stock was Bullish 83.3% of the time following Bullish Price action events since the beginning of 2020. Here is the key Price Action event performance of the Stock:
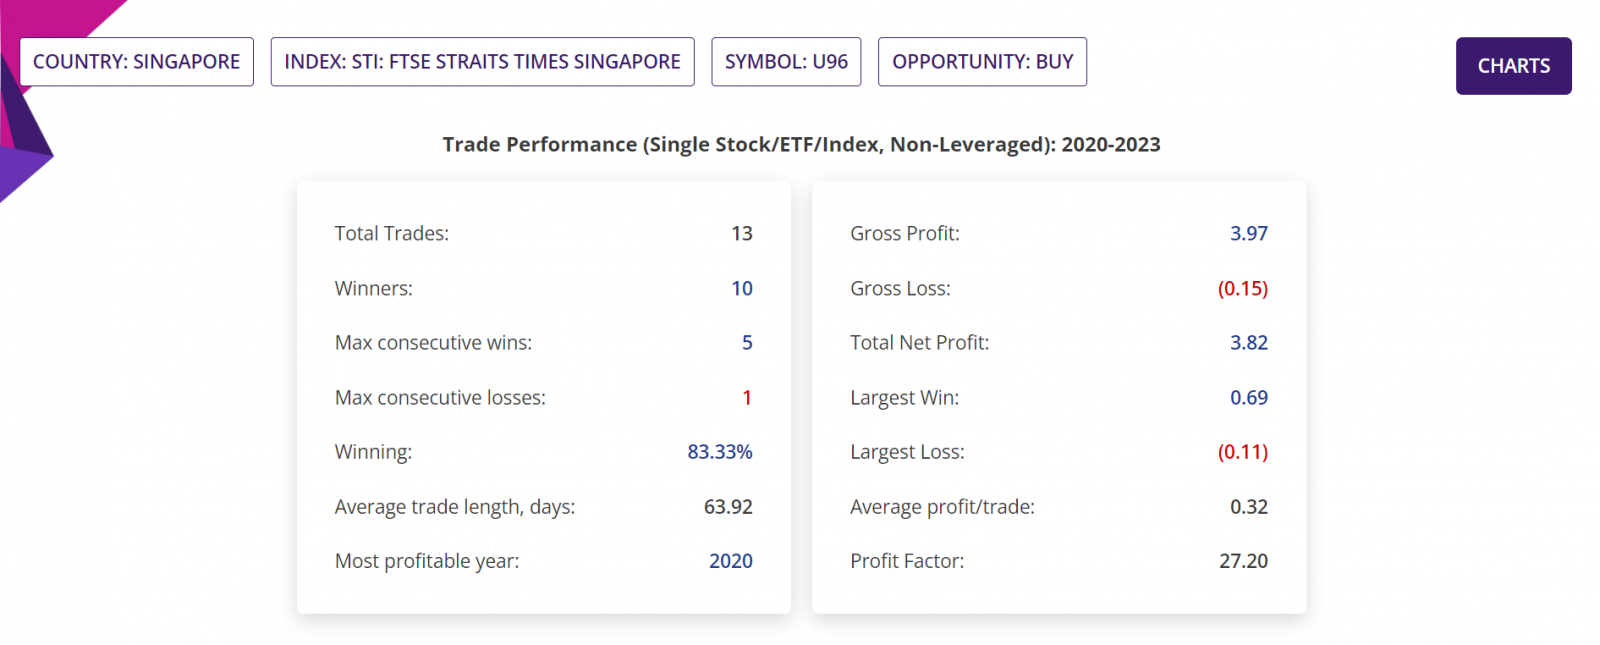
Summary report: Since beginning of 2020, there were 13 BULLISH Price action events, of which one event is yet to be traded, that is the current Bullish trading opportunity being discussed in this blogpost. These leaves 12 completed trades, of which 10 were winners (and hence 83.3% confidence or Probability) with average move up (AMU) of 25.24% and average move down (AMD) of 5.56% for an average holding time (ADH) of about 41 days.
Historical RRR in those completed trades was 3.65:1. Please note that RRR shown here is a worst-case scenario, as many trades could be closed sooner with higher profit compared to trades closed at the end of 9-week period.
Detailed Report, Trade Performance: If 10,000 stocks were bought following those BULLISH Price action events, then a trader would have had a Gross Profit of SGD39,700, Gross Loss of SGD1,500, making a Total Net Profit of SGD38,200. In those closed trades, the Largest Win was SGD6,900, Largest Loss is SGD1,100, the Average profit/trade being SGD3,200. All figures above are in Singapore Dollars.
The Profit Factor (which is quotient of Gross Profit and Gross Loss) in those trades was a whopping 27.20.
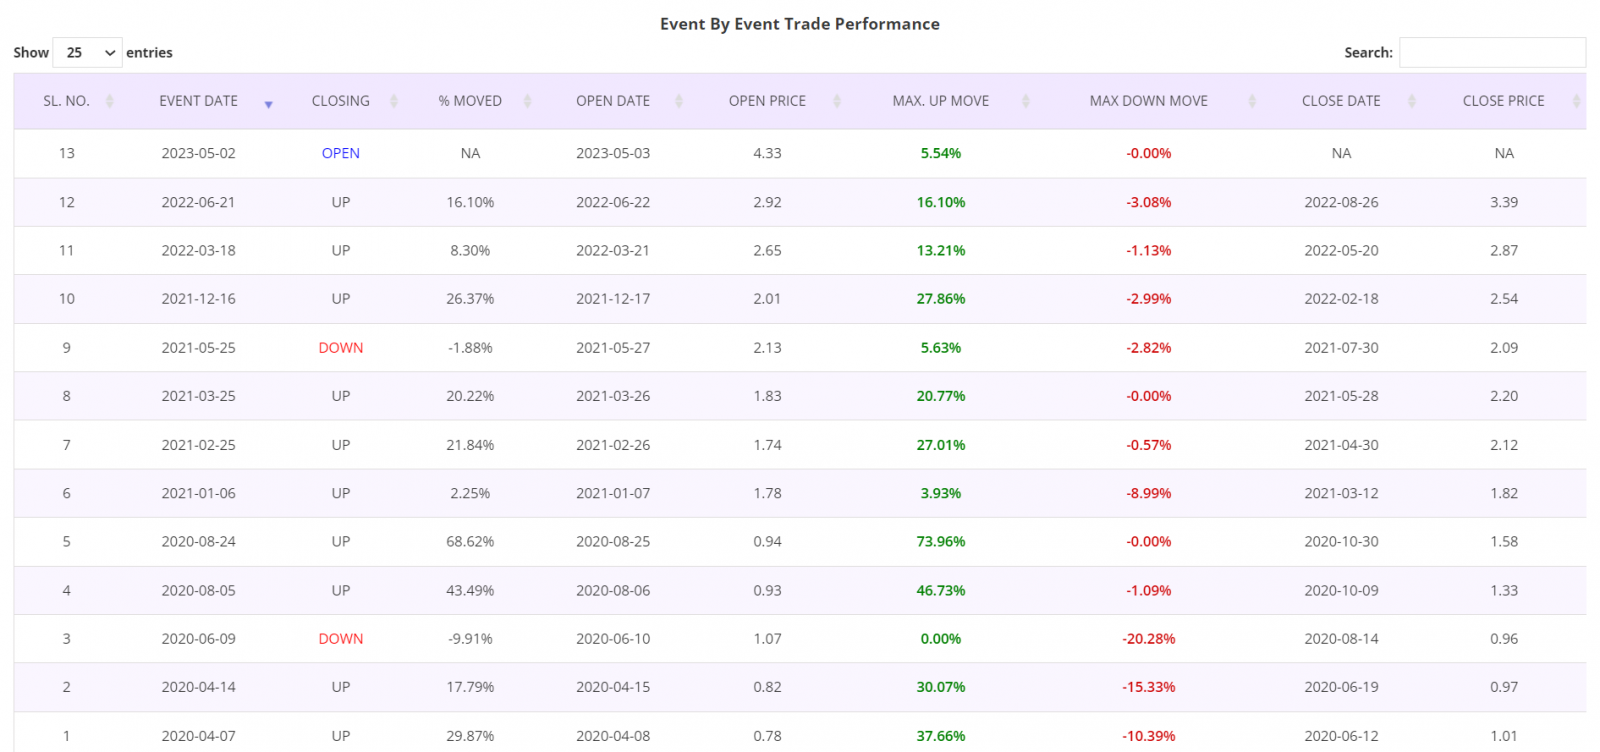
Detailed Report, Trade by Trade Performance: Results of each trade taken following the Price Action events since the beginning of 2020 are as shown in the table below. As can been seen in the table, 10 trades were winners and two losers out of total of 13 trades. These tables are from the Detailed report of the Price Action trading app.
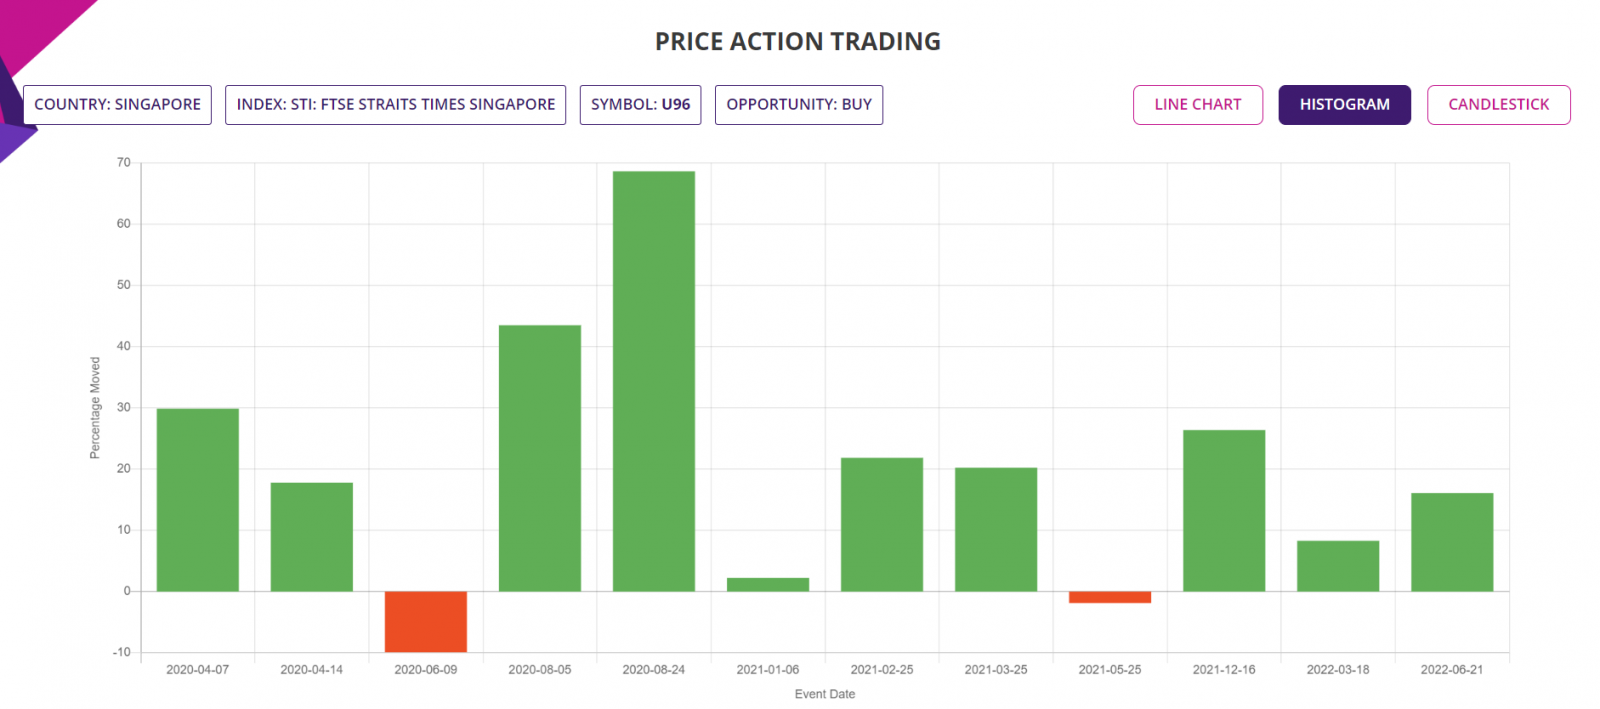
Histogram Chart: The chart below shows the percentage moves of the underlying Stock of Interest following each Price Action event for the period of analysis mentioned earlier, for a quick visual clue of the trade-by-trade performance.
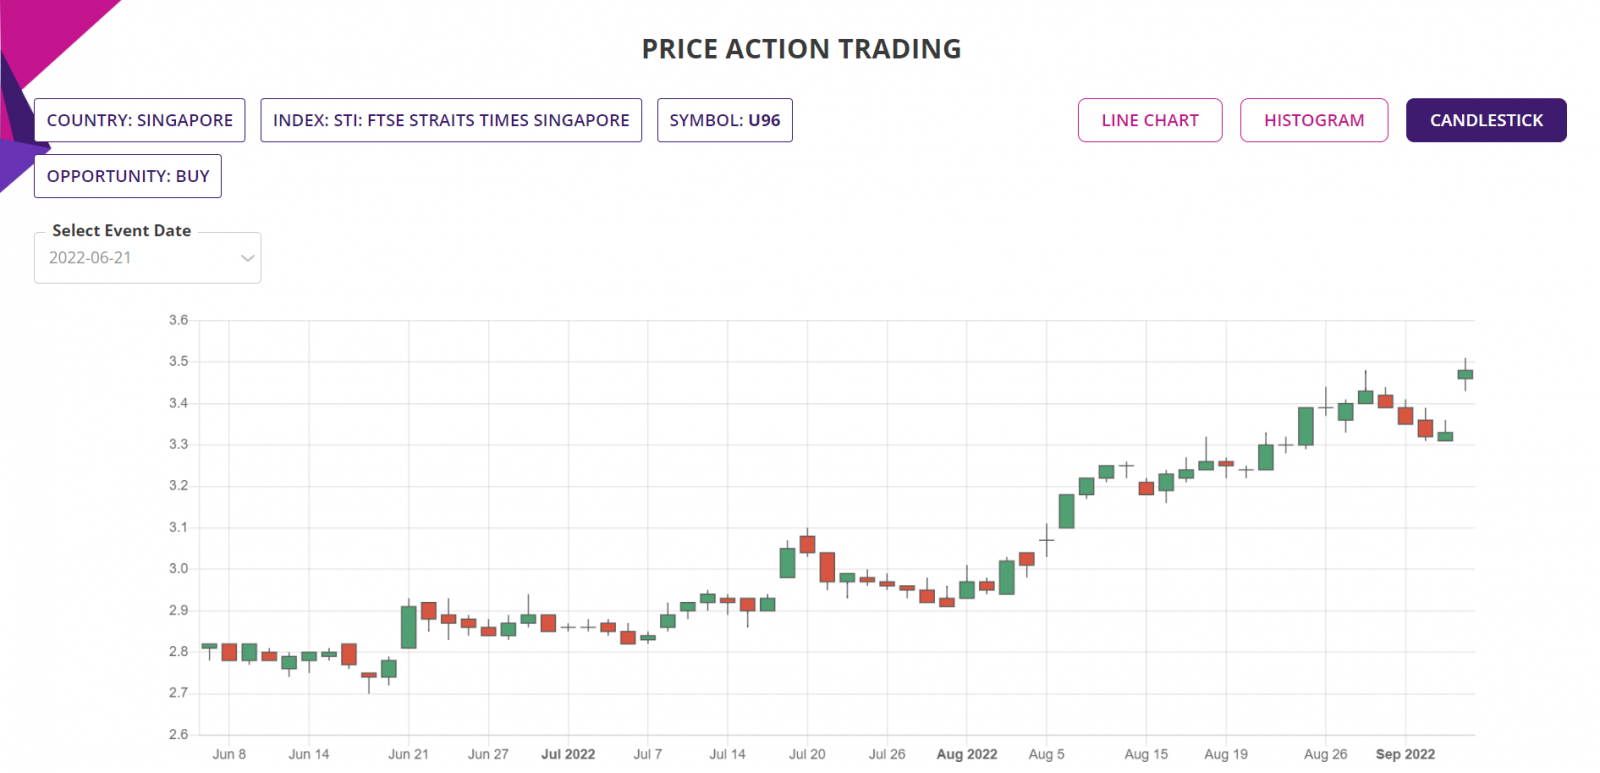
Candlestick Chart: The candlestick chart of the underlying Stock/ETF’s latest performance is as shown below. In the web-based Price Action trading app, the chart is available for all the price action events since the year in the “Data since” in the input filter page.
Trade Structure:
If we had traded the Stock this week, then we would have structured the trade as follows, using CFD:
|
TRADE STRUCTURE (All prices in Singapore Dollars or SGD) |
||
|
Stock price |
$4.58 |
USD |
|
CFDs |
10,000 |
Number of Stocks used for this CFD trde |
|
CFD Margin |
5% |
CFD leverage |
|
|
|
|
|
Margin |
$2,290.00 |
Amount of fund required for the trade |
|
|
|
|
|
Target Stock price |
$5.04 |
10% above the current price, limit order placed at this underlying price |
|
Stop Stock price |
$4.44 |
3% below the current price, guaranteed stop at this price |
|
|
|
|
|
Profit Target |
$4,580.00 |
|
|
Stop Loss |
$1,374.00 |
|
|
RRR |
3.33 |
|
|
RoI |
200% |
Potential return of investment |
The choice of RRR of 3.33:1 is in line with the worst-case average RRR from the last 12 completed trades following the Price Action events since 2020 till date. Please note that the RoI mentioned above does not include any transaction costs such as broker commissions and CFD interest payable during the period the position is held. 5% leverage is assumed for CFD trade, but please check with your broker if they allow to trade CFD and what is the leverage allowed if CFD trade is available. CFD leverage varies from underlying to underlying, please check with your broker.
Further Information about trading applications:
Please visit the following URL for more information on various trading applications from Sapphire Capitals which are designed to deliver high probability trading opportunities for swing trading as well as for intraday trading:
https://www.sapphirecapitals.com/pages/swing-trading-stock-seasonality-strategy/
https://www.sapphirecapitals.com/pages/swing-trading-stock-price-action-strategy/
https://www.sapphirecapitals.com/pages/swing-trading-volume-spike-stock-trading-strategy/
https://www.sapphirecapitals.com/pages/day-trading-intraday-seasonality-trading/
Disclaimer:
Sapphire Private Assets (ABN: 34 613 892 023, trading as Sapphire Capitals) is not a broker or a financial adviser but an education and research organisation; we provide training and tools for traders and DIY fund managers for trading in global financial markets. The contents of the blog have been produced by using technical analysis and trading applications developed by Sapphire Capitals for the Stock and ETF traded worldwide. The contents of this blog are intended for education and research purposes only and is not a recommendation or solicitation to invest in any Stock or ETF.
For more details, please visit www.sapphirecapitals.com/Disclaimer.


