
-
 Admin123 :
Admin - Sapphire Capitals
Admin123 :
Admin - Sapphire Capitals -
 Date :
2023-06-25
Date :
2023-06-25
Stock In Focus - Week 26 (2023) – AUSTRALIA – SEASONALITY TRADING STRATEGY
The week beginning Monday, the 26th June is Week 26 as per ISO numbering convention of the weeks of a year. Seasonality trading strategy involves studying Stocks and ETFs for historically strong seasonal bullish or bearish moves that we could use to open a BUY trade and profit from the bullish move or open a SELL trade from a bearish move.
Country in focus:
This week we look at the Stocks from AUSTRALIA in S&P ASX200 index.
Stock/ETF in focus:
Specific Stock in focus is Lifestyle Communities Limited (Ticker: LIC). The Stock is listed in the Australian Stock Exchange (ASX) of Australia, the trading currency being Australian Dollars or AUD in short.
Trade Direction:
BULLISH, Seasonality study for last 10 years reveal 90.0% probability of success in a BUY (LONG) trade for this week (Week 26) and 100% probability for the trade next week (Week 21) and two weeks thereafter.
Please note that probability is not certainty. Although, historically, the Stock was bullish 90% of the time in Week 26 and 100% of the time in Week 27, but there is always a probability that the Stock do not perform as per historical patterns. As such, always trade with strict money management principles such as allocation of a portion of the trading capital and use a guaranteed stop in the event the Stock price makes an adverse move.
Please see the Summary report screenshot later in the blog.
Overview:
Lifestyle Communities Limited, together with its subsidiaries, provides housing for its homeowners in community in Australia. The company was incorporated in 1997 and is based in Melbourne, Australia.
The company operates 26 communities, including 19 in operation and 7 in planning or development. It serves working, semi-retired, and retired people. The company was formerly known as Namberry Limited and changed its name to Lifestyle Communities Limited in June 2007.
(Courtesy: Yahoo Finance)
Sector and Industry Details:
Sector(s): Real Estate
Industry: Real Estate—Diversified
Full Time Employees: 120
(Courtesy: Yahoo Finance)
Fundamentals:
52 Week Range 13.10 - 20.32
Avg. Volume 312,688
Market Cap 1.504B
PE Ratio (TTM) 17.34
EPS (TTM) 0.83
Ex-Dividend Date Mar 03, 2023
1y Target Est 19.75
(Courtesy: Yahoo Finance)
Current trading price:
As of Friday close of 23rd June 2023, the stock was trading at 14.39. All prices are in AUD.
SEASONALITY:
The stock demonstrated very strong SEASONAL move in week 26 of the year, here are the details of its SEASONAL behavior.
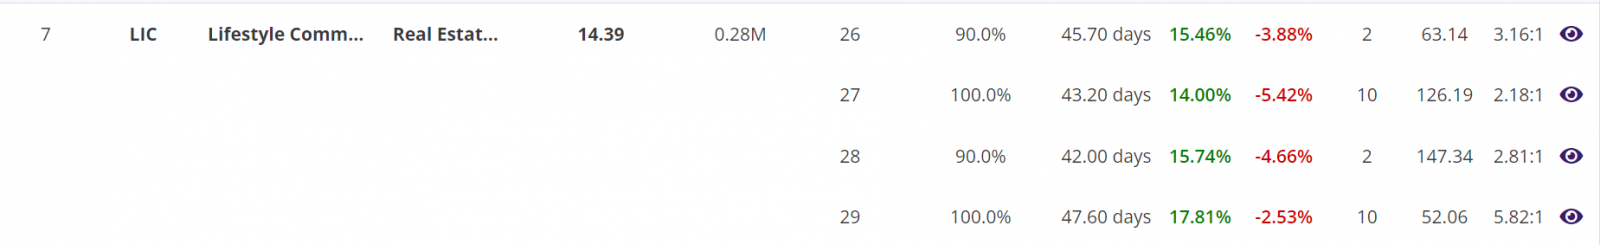
Summary report: In 9 out of last 10 years in week 26, the stock was BULLISH with average move up (AMU) of 15.46% and average move down (AMD) of -3.88% for an average holding time (ADH) of 46 days. The worst-case average Reward-Risk Ratio (RRR) for all 10 trades over last 10 years was a whopping 3.16:1. See the summary report table below:

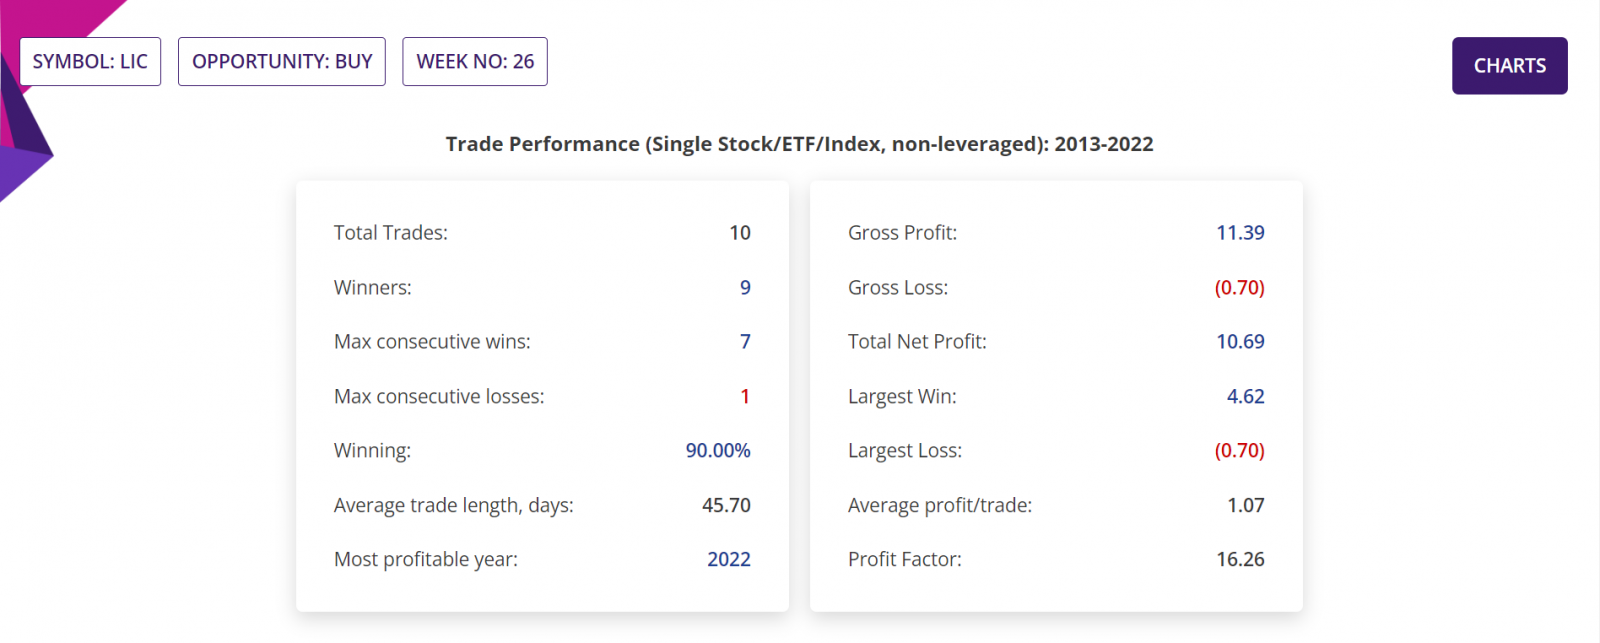
Detailed Report, Trade Performance: If only 1,000 stocks were bought in the beginning of week 26 every year for last 10 years, then a trader would have had a Gross Profit of AUD11,390, Gross Loss of AUD700, making a Total Net Profit of AUD10,690. No leverage applied in the numbers above.
In those 10 years, the Largest Win was AUD4,620, Largest Loss was AUD700 and this was the only in last 10 years, the Average profit/trade being AUD1,070, Profit factor (quotient of Gross Profit and Gross Loss) being 16.26. All figures are gross and excluding trading commissions or any brokerage fees. Please see the section of the detailed report below.
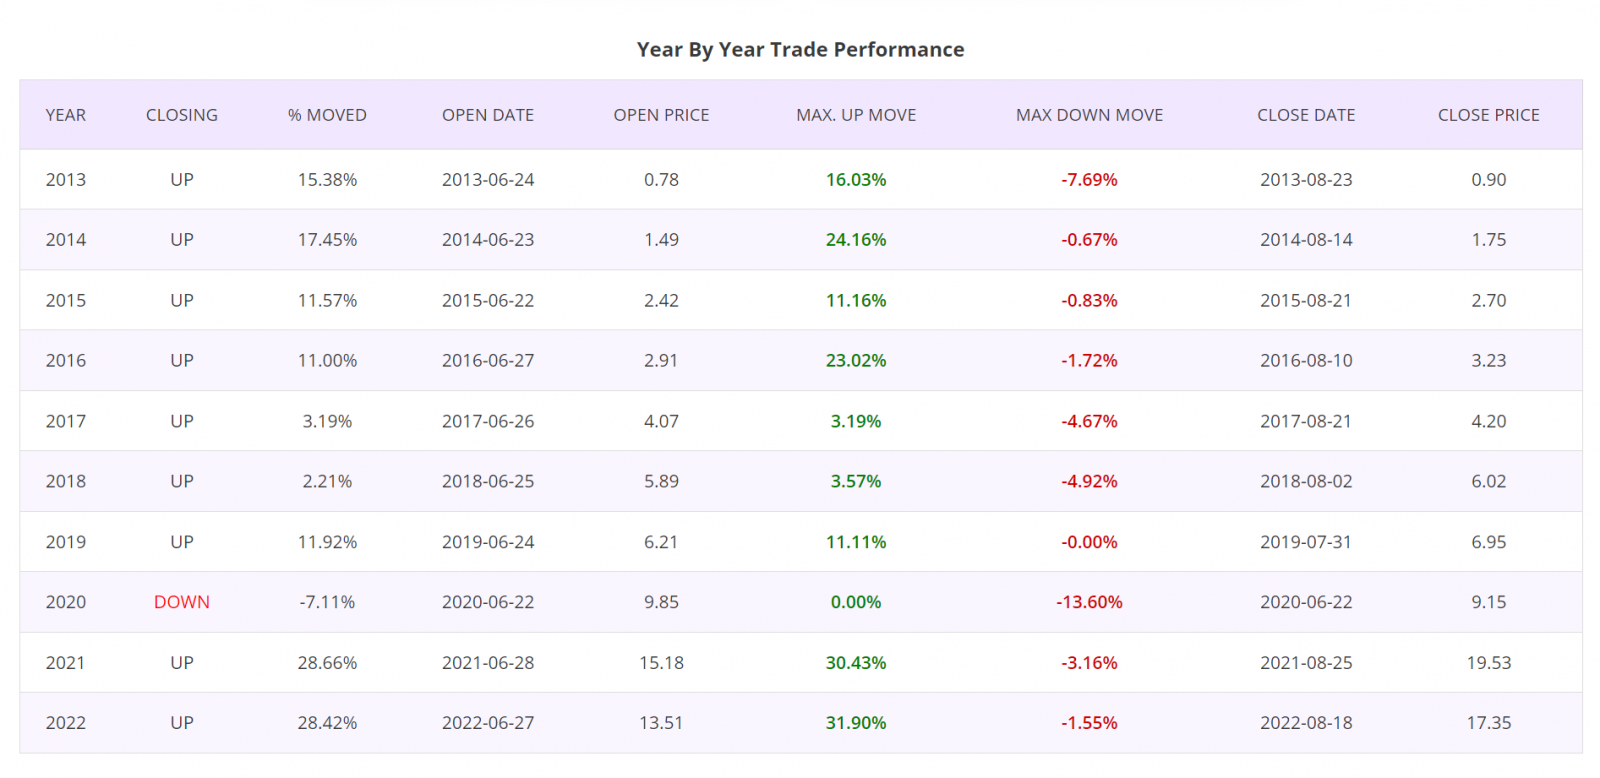
Detailed Report, Year by Year Trade Performance: Trades taken at the beginning of Week 26 for all years of last 10 years were winners. In the table below, notice the very significant seasonal move in each of the years over last 10 years.
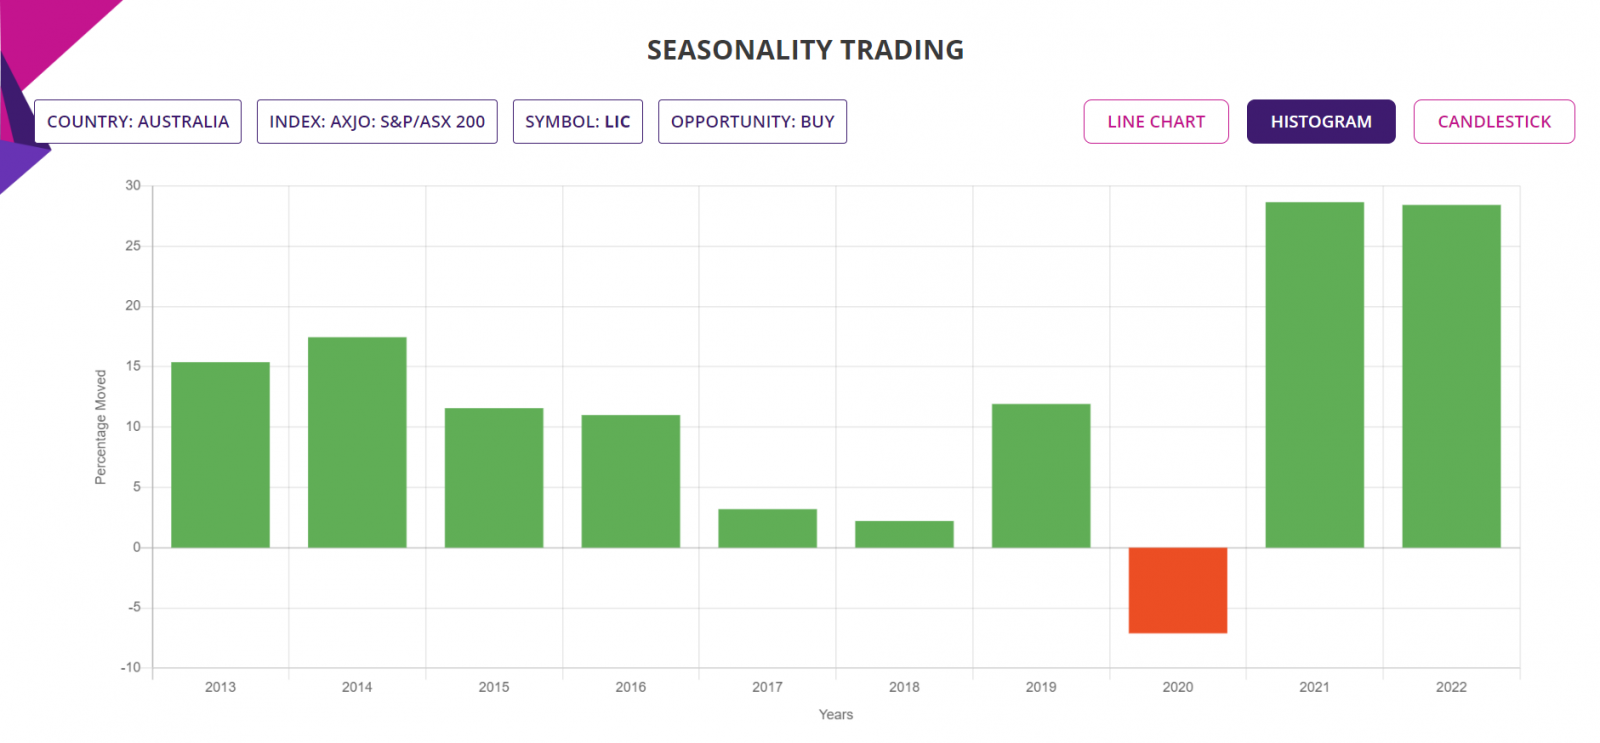
Histogram Chart: The chart below shows the percentage moves of the underlying Stock of Interest in each of the years in the Seasonality analysis, for a quick visual clue of the year-by-year trade performance. There are nine GREEN bars and only one RED bar for the only loss in last 10 years.
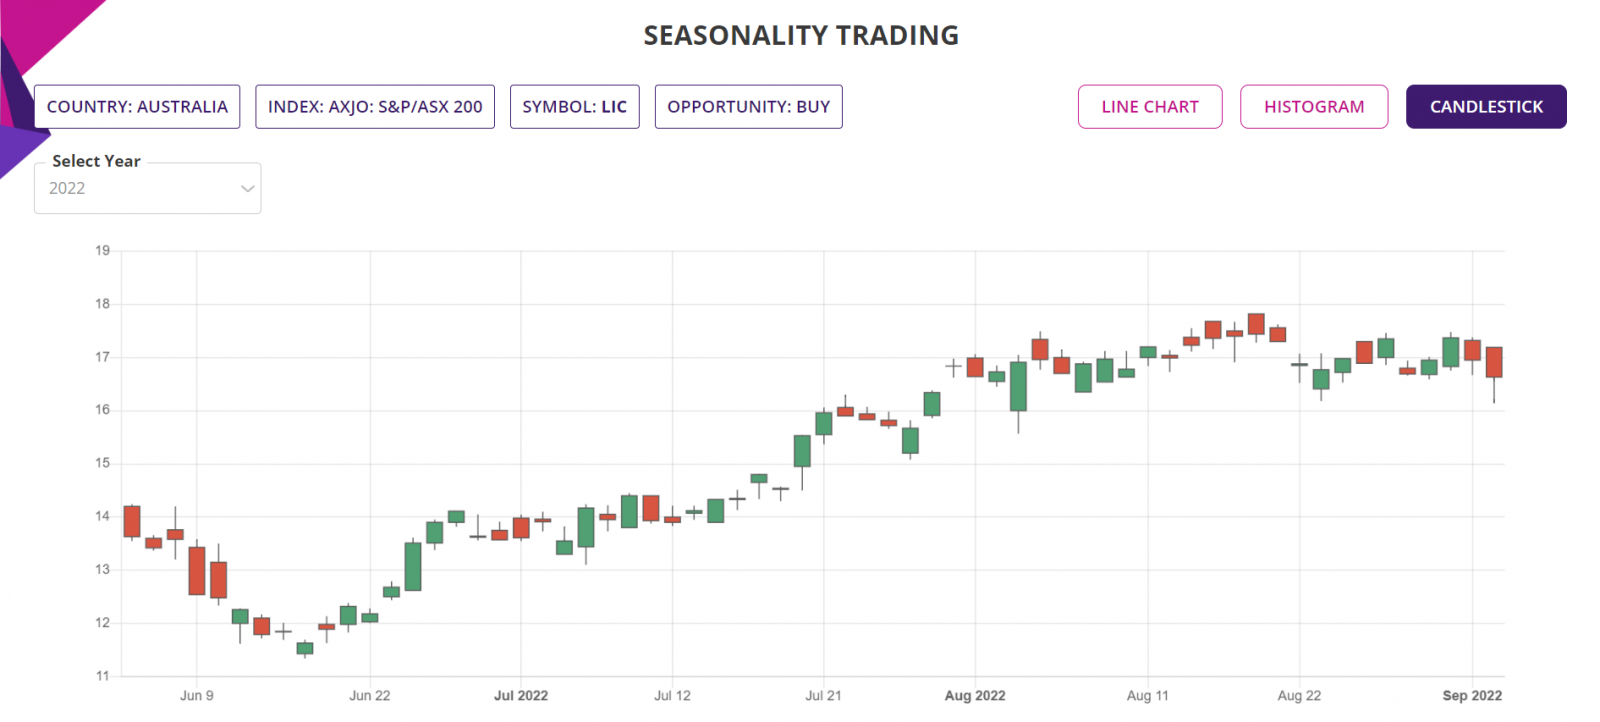
Candlestick Chart: The candlestick chart of the underlying Stock/ETF’s latest performance in year 2022 is as shown below. In the web-based Seasonality trading application, the chart is available for all the years of the Seasonality analysis, in this case, all the last 10 years.
Trade Structure:
If we trade the Stock this week, then we would structure the trade as CFD trade as follows:
|
TRADE STRUCTURE (All prices in Australian Dollars or AUD) |
||
|
Stock price |
$14.39 |
Assuming trade placed at last traded price |
|
CFDs |
1,000 |
Number of Stocks used for this CFD trade |
|
CFD Margin |
10% |
CFD leverage |
|
|
|
|
|
Margin |
$1,439 |
Amount of fund required for the trade |
|
|
|
|
|
Target Stock price |
$16.55 |
15% above the current price, limit order placed at this underlying price |
|
Stop Stock price |
$13.67 |
5% below the current price, guaranteed stop at this price |
|
|
|
|
|
Profit Target |
$2,159 |
|
|
Stop Loss |
$720 |
|
|
RRR |
3.00 |
|
|
RoI |
150% |
Not accounting for any commission or CFD interest |
The choice of RRR of 3.00:1 is in line with the average RRR from the last 10 trades in each of the last 10 years in Week 20, since 2013 till 2022.
Further Information about trading applications:
Please visit the following URL for more information on various trading applications from Sapphire Capitals which are designed to deliver high probability trading opportunities for swing trading as well as for intraday trading:
https://www.sapphirecapitals.com/pages/swing-trading-stock-seasonality-strategy/
https://www.sapphirecapitals.com/pages/swing-trading-stock-price-action-strategy/
https://www.sapphirecapitals.com/pages/swing-trading-volume-spike-stock-trading-strategy/
https://www.sapphirecapitals.com/pages/day-trading-intraday-seasonality-trading/
Disclaimer:
Sapphire Private Assets (ABN: 34 613 892 023, trading as Sapphire Capitals) is not a broker or a financial adviser but an education and research organization; we provide training and tools for traders and DIY fund managers for trading in global financial markets. The contents of the blog have been produced by using technical analysis and trading applications developed by Sapphire Capitals for the Stock and ETF traded worldwide. The contents of this blog are intended for education and research purposes only and is not a recommendation or solicitation to invest in any Stock or ETF.
For more details, please visit www.sapphirecapitals.com/Disclaimer.


