
-
 Admin123 :
Admin - Sapphire Capitals
Admin123 :
Admin - Sapphire Capitals -
 Date :
2023-04-16
Date :
2023-04-16
Stock of interest - Week 16 (2023) – CANADA – PRICE ACTION TRADING STRATEGY
The week beginning Monday, the 17th April is Week 16 as per ISO numbering convention of the weeks of a year.
Country in focus:
This week we look at the Stocks from CANADA in S&P TSX COMPOSITE index. The S&P/TSX Composite Index is the benchmark Canadian index, representing roughly 70% of the total market capitalization on the Toronto Stock Exchange (TSX) with about 250 companies included in it.
Stock/ETF in focus:
Specific Stock in focus is Cameco Corporation (Ticker: CCO). The trading currency is Canadian Dollars or CAD.
Trade Direction:
BULLISH, Price Action study since 2020 reveal 75% probability of success with historical worst-case RRR of over 1.67:1 in all completed BUY (LONG) trade.
Most Recent Event: Most recent Price Action event was on Thursday, the 13th April. Preferred trade opening is the next market open day on Friday, the 14th April or Monday, the 17th April.
Overview:
Cameco Corporation provides uranium for the generation of electricity. Cameco Corporation was incorporated in 1987 and is headquartered in Saskatoon, Canada.
It operates through two segments, Uranium and Fuel Services. The Uranium segment is involved in the exploration for, mining, and milling, purchase, and sale of uranium concentrate. The Fuel Services segment engages in the refining, conversion, and fabrication of uranium concentrate, as well as the purchase and sale of conversion services. This segment also produces fuel bundles and assemblies, and zirconium-based reactor components for CANDU reactors. The company offers nuclear fuel processing services. It sells its uranium and fuel services to nuclear utilities in the Americas, Europe, and Asia.
(Courtesy: Yahoo Finance)
Sector and Industry Details:
Sector(s): Energy
Industry: Uranium
Full Time Employees: 3,300
(Courtesy: Yahoo Finance)
Fundamentals:
52 Week Range 26.15 - 40.81
Avg. Volume 1,238,400
Market Cap 15.158B
Beta (5Y Monthly) 0.95
PE Ratio (TTM) 159.09
EPS (TTM) 0.22
Earnings Date Apr 28, 2023
Ex-Dividend Date Nov 29, 2022
1y Target Est 46.90
(Courtesy: Yahoo Finance)
Current trading price:
As of Thursday, the 13th April 2023, or the day the Price Action event took place, the stock closed at 35.19. The last closing price on Friday, the 3rd March was 35.00.
PRICE ACTION:
The Stock was Bullish 75% of the time following Bullish Price action events since the beginning of 2020. Here is the key Price Action event performance of the Stock:
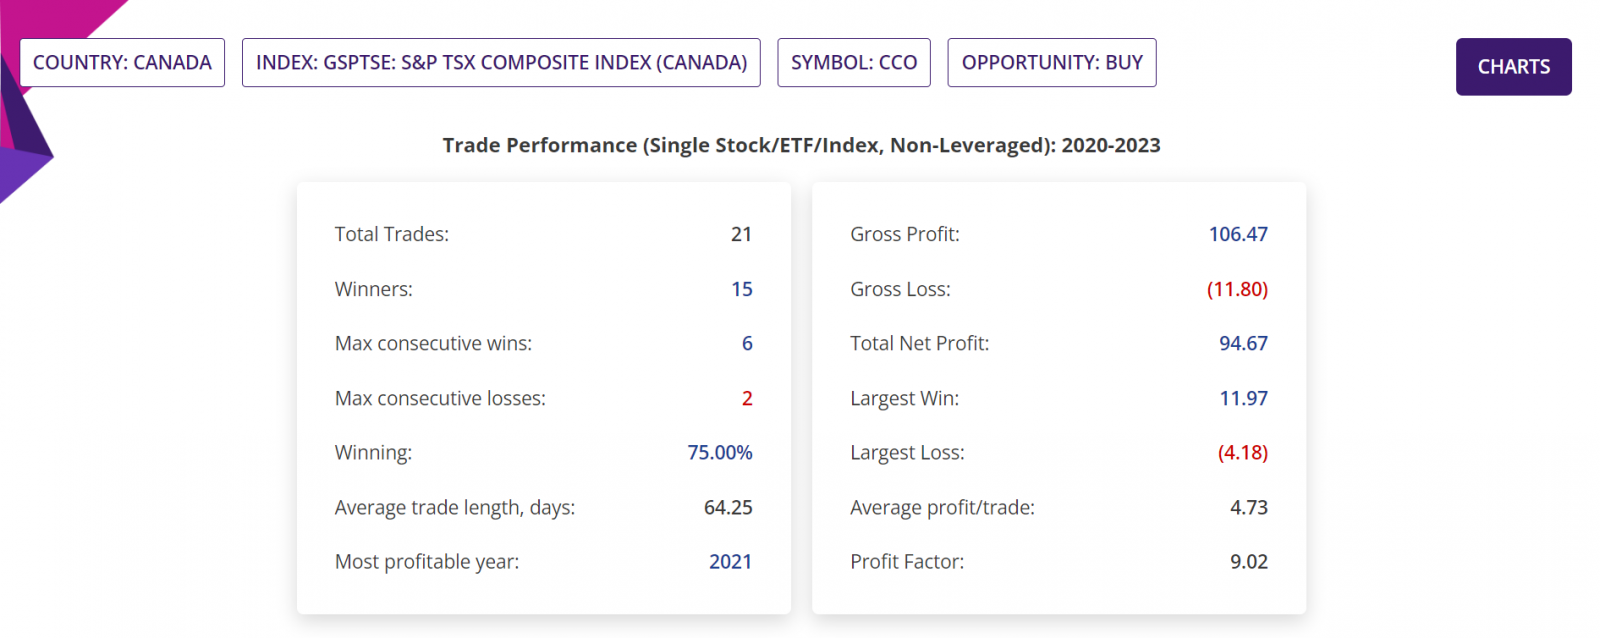
Summary report: Since beginning of 2020, there were 21 BULLISH Price action events, of which one event is yet to be traded, that is the current Bullish trading opportunity being discussed in this blogpost. These leaves 20 completed trades, of which 15 were winners (and hence 75% confidence or Probability) with average move up (AMU) of 25.62% and average move down (AMD) of 8.57% for an average holding time (ADH) of about 45 days.
Historical RRR in those completed trades was 1.67:1. Please note that RRR shown here is a worst-case scenario, as many trades could be closed sooner with higher profit compared to trades closed at the end of 9-week period.

Detailed Report, Trade Performance: If 100 stocks were bought following those BULLISH Price action events, then a trader would have had a Gross Profit of CAD10, 647, Gross Loss of CAD1,180, making a Total Net Profit of CAD9,467. In those closed trades, the Largest Win was CAD1,197, Largest Loss is CAD418, the Average profit/trade being CAD473. All figures above are in Canadian Dollars.
The Profit Factor (which is quotient of Gross Profit and Gross Loss) in those trades was a whopping 9.02.
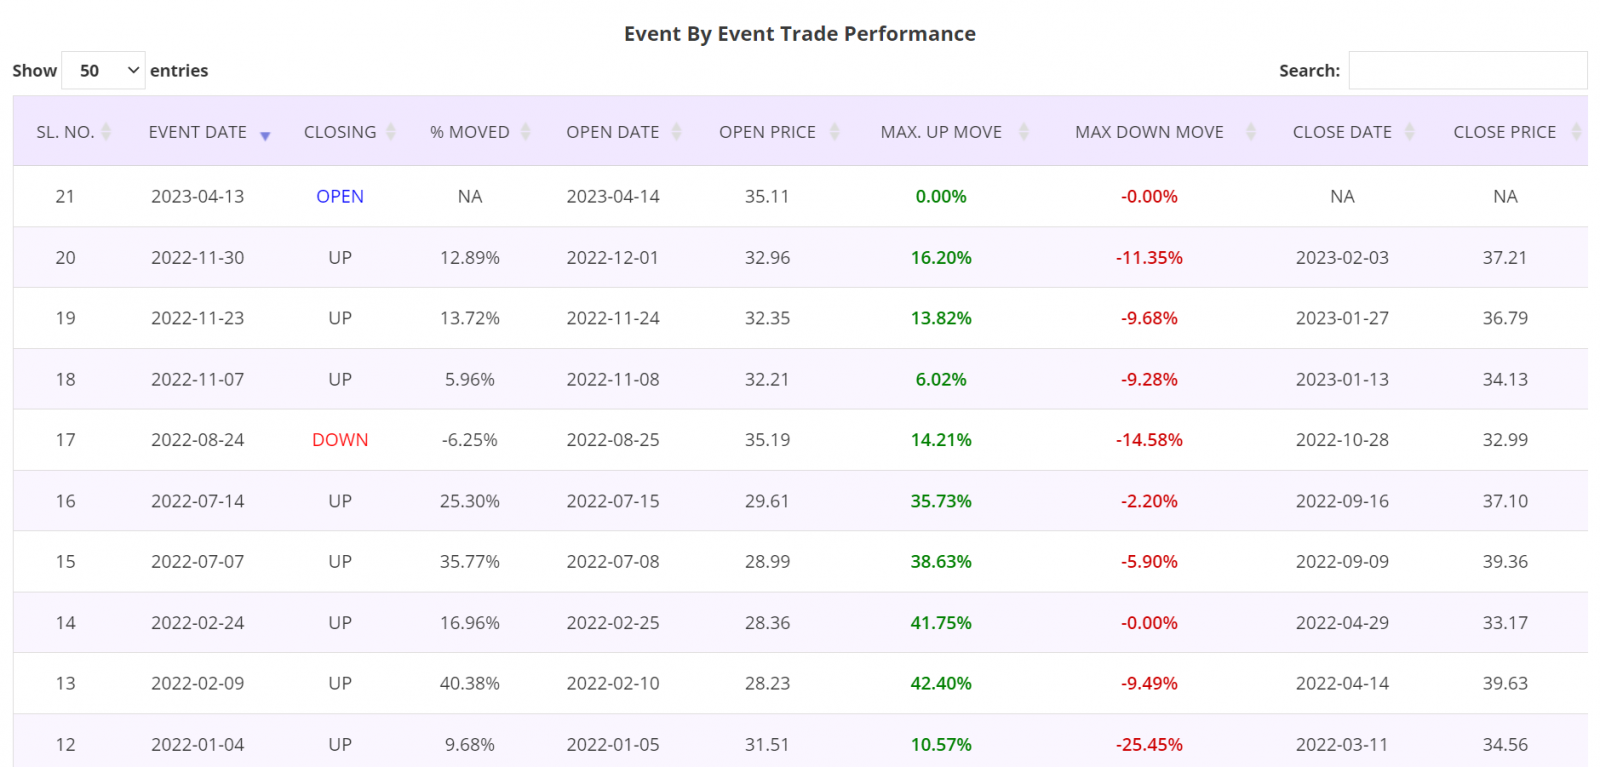
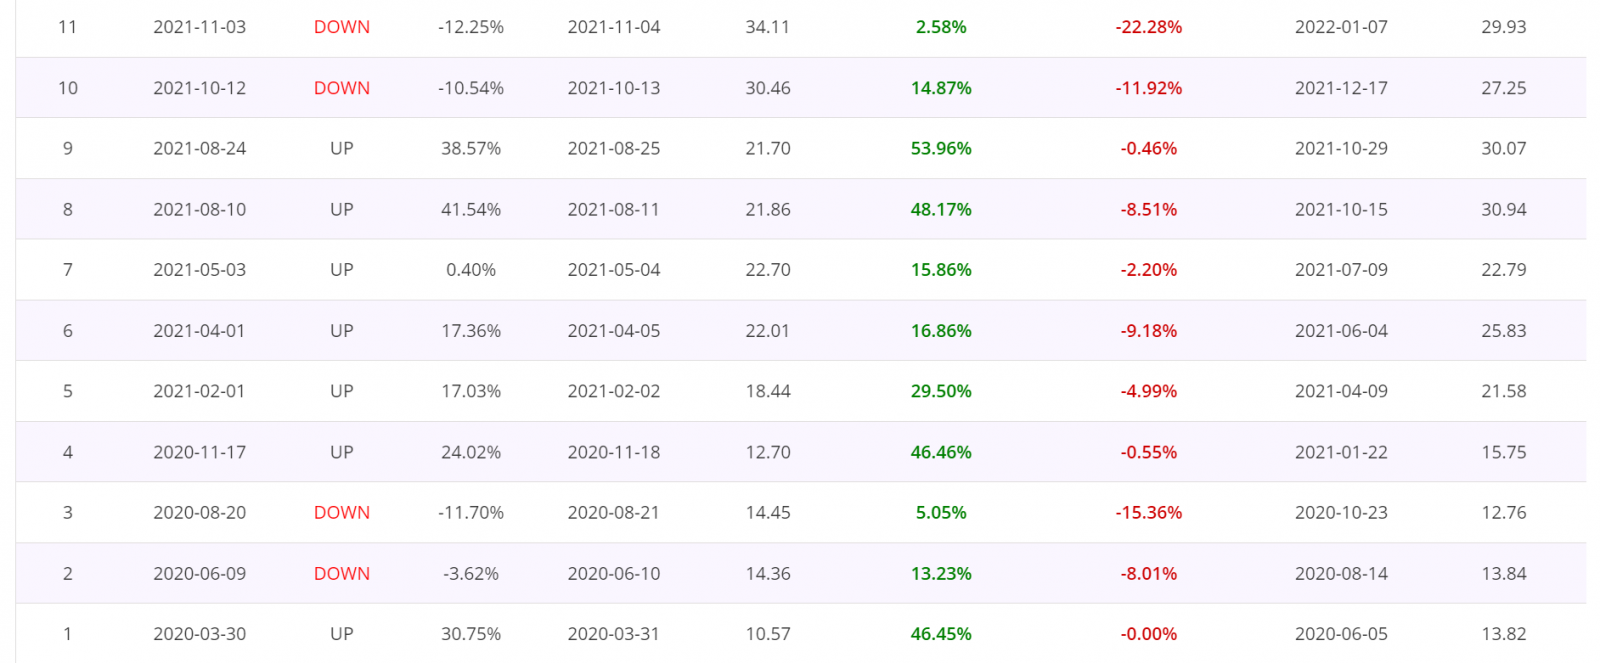
Detailed Report, Trade by Trade Performance: Results of each trade taken following the Price Action events since the beginning of 2020 are as shown in the table below. As can been seen in the table, 15 trades were winners and 5 losers out of total of 20 completed trades. These tables are from the Detailed report of the Price Action trading app.
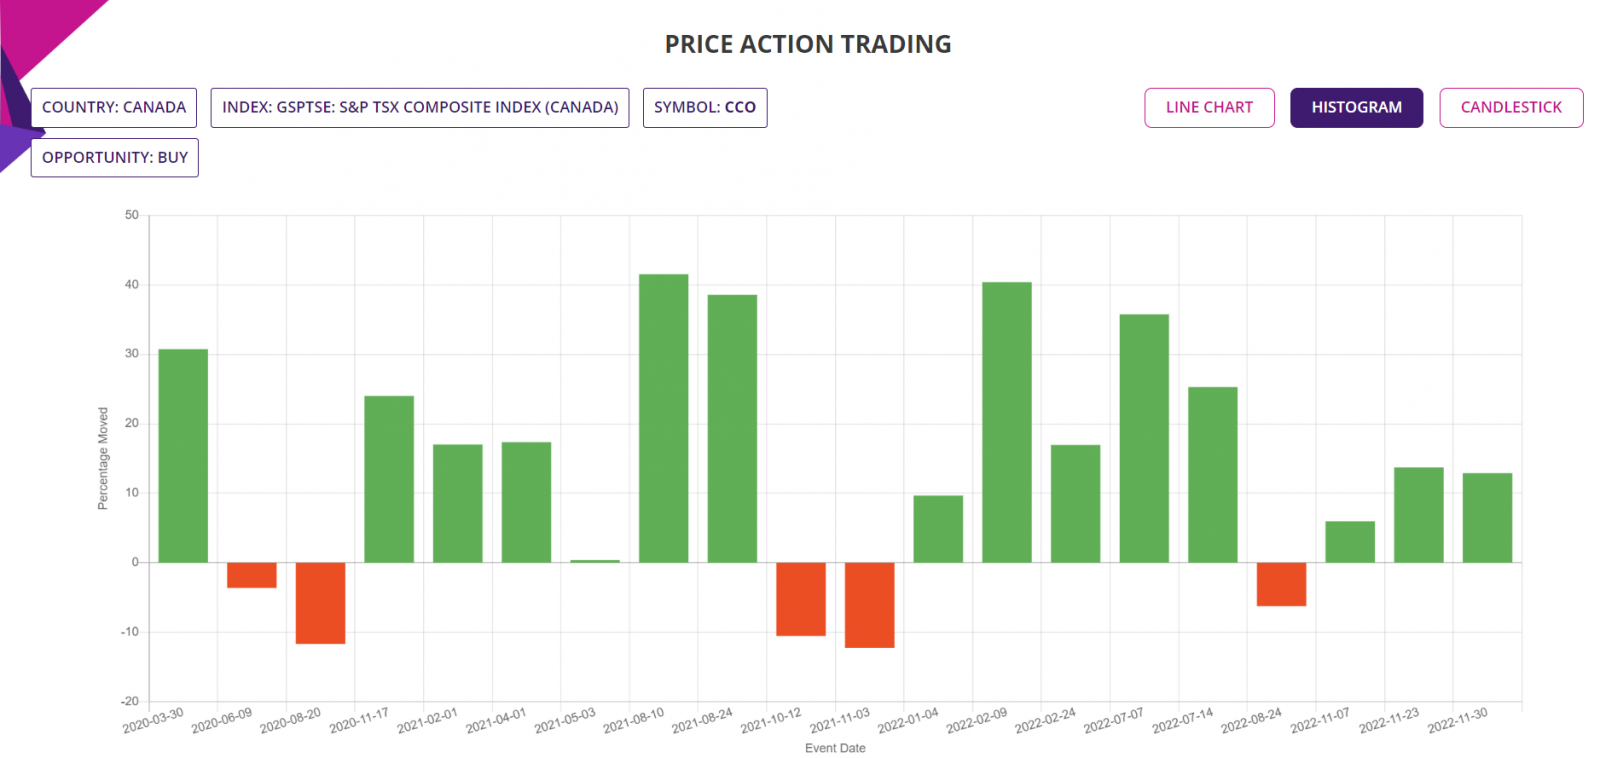
Histogram Chart: The chart below shows the percentage moves of the underlying Stock of Interest following each Price Action event for the period of analysis mentioned earlier, for a quick visual clue of the trade-by-trade performance.
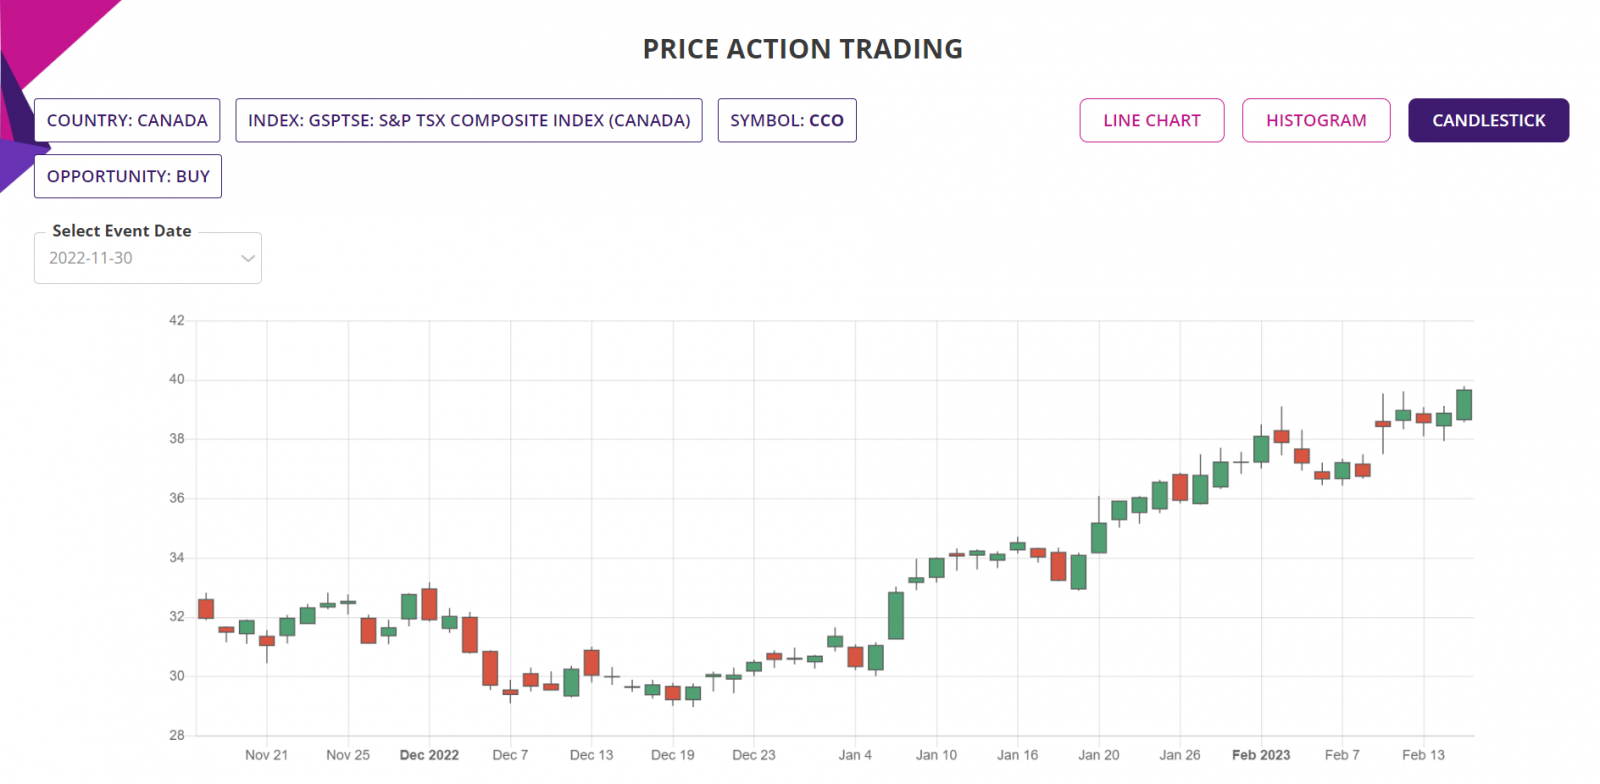
Candlestick Chart: The candlestick chart of the underlying Stock/ETF’s latest performance is as shown below. In the web-based Price Action trading app, the chart is available for all the price action events since the year in the “Data since” in the input filter page.
Trade Structure:
If we had traded the Stock this week, then we would have structured the trade as follows:
|
TRADE STRUCTURE (All prices in Canadian Dollars or CAD) |
||
|
Stock price |
35.00 |
Assuming trade placed at last traded price |
|
Stocks |
1,000 |
Number of Stocks used for this trade |
|
Investment required |
35,000 |
Amount of fund required for the trade |
|
|
|
|
|
Target Stock price (TP) |
42.00 |
16% above the current price |
|
Stop Stock price (SL) |
32.20 |
8% below the current price |
|
|
|
|
|
Profit Target |
7,000 |
Limit order placed at underlying TP price |
|
Stop Loss |
2,800 |
Guaranteed stop at SL price |
The choice of RRR of 2.5:1 is in line with the average RRR from the last 20 trades following the Price Action events since 2020 till date.
Further Information about trading applications:
Please visit the following URL for more information on various trading applications from Sapphire Capitals which are designed to deliver high probability trading opportunities for swing trading as well as for intraday trading:
https://www.sapphirecapitals.com/pages/swing-trading-stock-seasonality-strategy/
https://www.sapphirecapitals.com/pages/swing-trading-stock-price-action-strategy/
https://www.sapphirecapitals.com/pages/swing-trading-volume-spike-stock-trading-strategy/
https://www.sapphirecapitals.com/pages/day-trading-intraday-seasonality-trading/
Disclaimer:
Sapphire Private Assets (ABN: 34 613 892 023, trading as Sapphire Capitals) is not a broker or a financial adviser but an education and research organisation; we provide training and tools for traders and DIY fund managers for trading in global financial markets. The contents of the blog have been produced by using technical analysis and trading applications developed by Sapphire Capitals for the Stock and ETF traded worldwide. The contents of this blog are intended for education and research purposes only and is not a recommendation or solicitation to invest in any Stock or ETF.
For more details, please visit www.sapphirecapitals.com/Disclaimer.


