
-
 Admin123 :
Admin - Sapphire Capitals
Admin123 :
Admin - Sapphire Capitals -
 Date :
2023-04-23
Date :
2023-04-23
Stock In Focus - Week 17 (2023) – USA – SEASONALITY TRADING STRATEGY
The week beginning Monday, the 24th April is Week 17 as per ISO numbering convention of the weeks of a year. Seasonality trading strategy involves studying Stocks and ETFs for historically strong seasonal bullish or bearish moves that we could use to place a BUY or SELL trade.
Country in focus:
This week we look at the Stocks from USA in S&P 500 index.
Stock/ETF in focus:
Specific Stock in focus Cintas Corporation (Ticker: CTAS). The Stock is listed in the Nasdaq Stock Exchange, trading currency being US Dollars or USD in short.
Trade Direction:
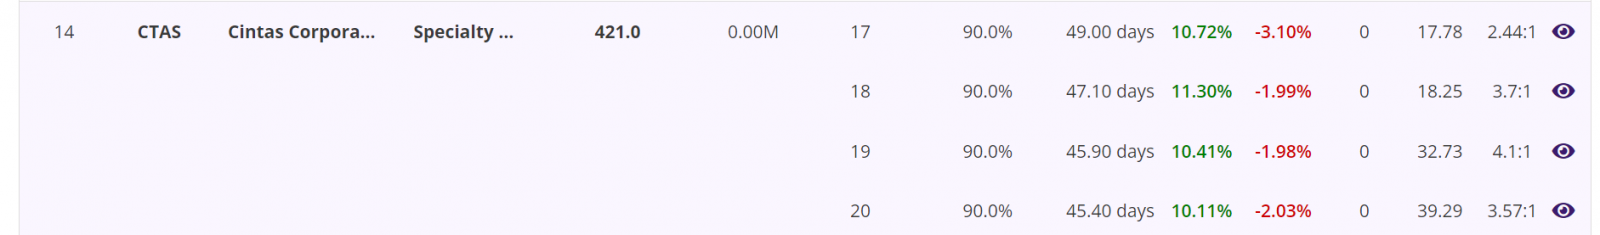
BULLISH, Seasonality study for last 10 years reveal 90.0% probability of success in a BUY (LONG) trade for this week (Week 17) and 90% probability for the trade next week (Week 18). Please see the Summary report screenshot later in the blog.
Overview:
Cintas Corporation provides corporate identity uniforms and related business services primarily in the United States, Canada, and Latin America. Cintas Corporation was founded in 1968 and is headquartered in Cincinnati, Ohio.
The company operates through Uniform Rental and Facility Services, First Aid and Safety Services, and All Other segments. The company rents and services uniforms and other garments, including flame resistant clothing, mats, mops and shop towels, and other ancillary items; and provides restroom cleaning services and supplies, as well as sells uniforms. It also offers first aid and safety services, and fire protection products and services. The company provides its products and services through its distribution network and local delivery routes, or local representatives to small service and manufacturing companies, as well as major corporations.
(Courtesy: Yahoo Finance)
Sector and Industry Details:
Sector(s): Industrials
Industry: Specialty Business Services
Full Time Employees: 43,000
(Courtesy: Yahoo Finance)
Fundamentals:
52 Week Range 343.86 - 470.23
Avg. Volume 335,987
Market Cap 46.77B
Beta (5Y Monthly) 1.33
PE Ratio (TTM) 36.91
EPS (TTM) 12.46
Earnings Date Jul 12, 2023 - Jul 17, 2023
Ex-Dividend Date May 12, 2023
(Courtesy: Yahoo Finance)
Current trading price:
As of Friday, close of 21st April 2023, the stock was trading at 459.87. All prices are in USD.
SEASONALITY:
The stock demonstrated very strong SEASONAL move in week 17 of the year, here are the details of its SEASONAL behaviour.
Summary report: In 9 out of last 10 years in week 17, the stock was BULLISH with average move up (AMU) of 10.72% and average move down (AMD) of -3.10% for an average holding time (ADH) of 49 days. The worst-case average Reward-Risk Ratio (RRR) for all 10 trades over last 10 years was a very respectable 2.44:1. See the summary report table below:

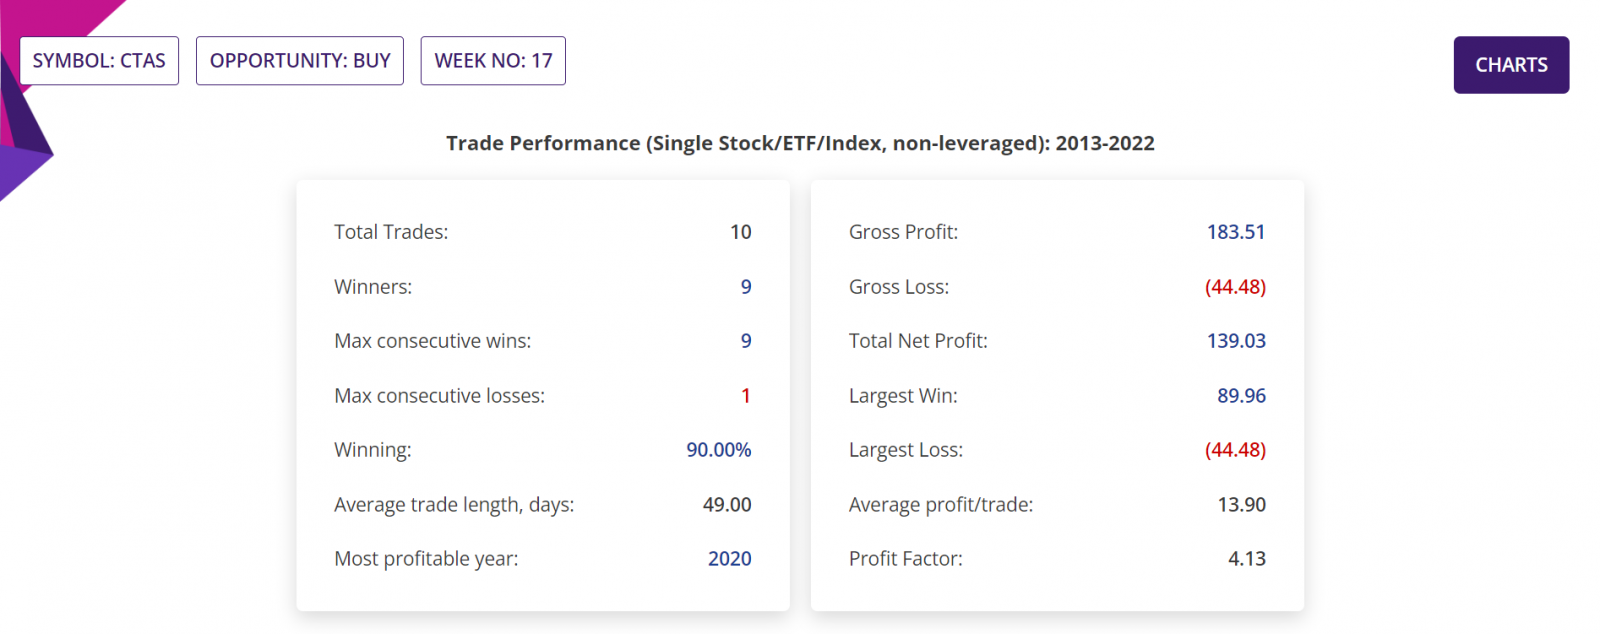
Detailed Report, Trade Performance: If only 1,000 stocks were bought in the beginning of week 17 every year for last 10 years, then a trader would have had a Gross Profit of USD183,510, Gross Loss of only USD44,480, making a Total Net Profit of USD139,030. No leverage applied in the numbers above but the sample trade we will talk about little later would use leverage as the trade is structured as CFD or Contract For Difference.
In those 10 years, the Largest Win was USD89,960, Largest Loss was USD44,480, the Average profit/trade being USD13,900. Profit factor (quotient of Gross Profit and Gross Loss) being 4.13. All figures gross and excluding trading commissions or any brokerage fees. Please see the section of the detailed report below.
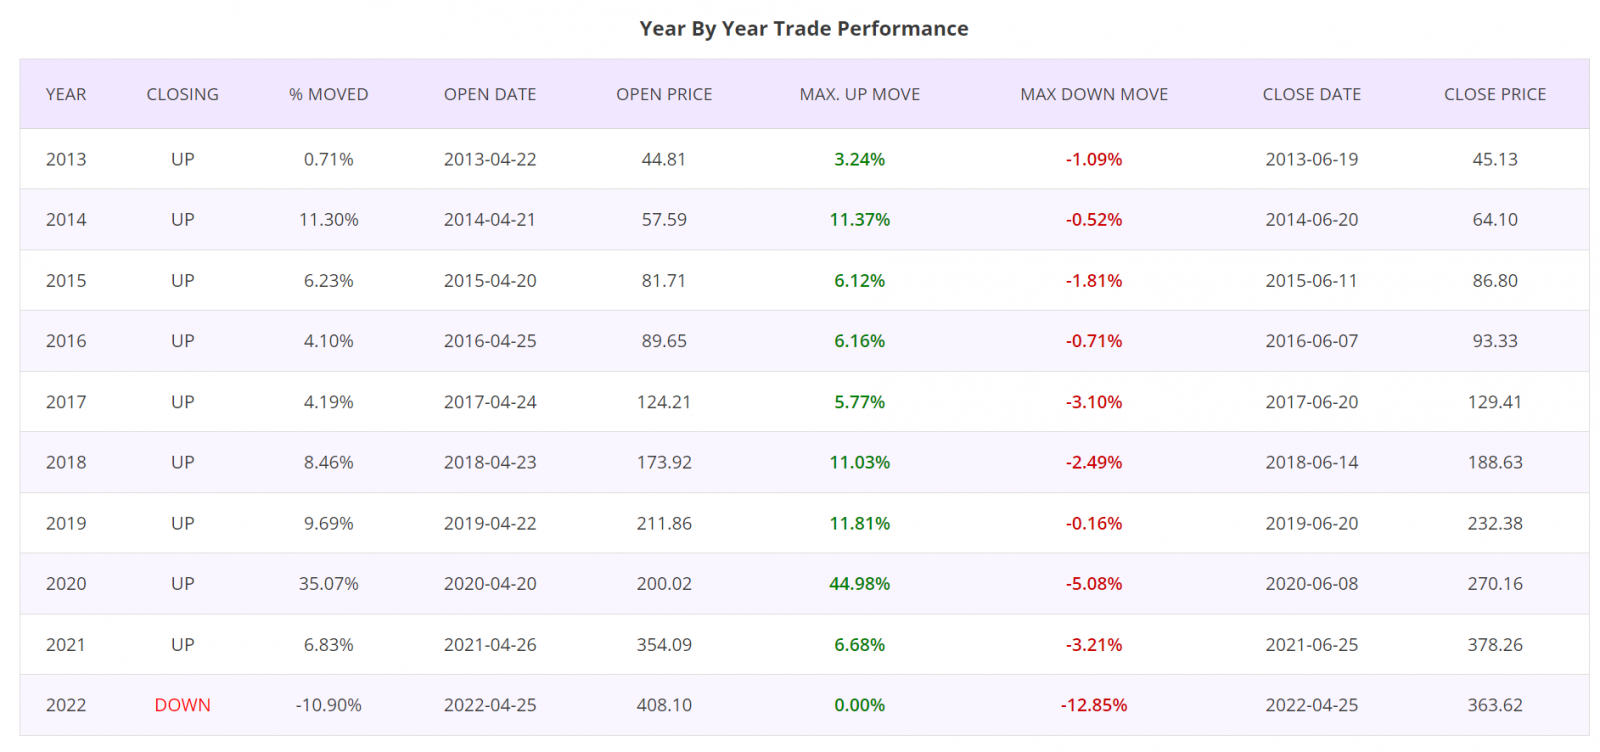
Detailed Report, Year by Year Trade Performance: Trades taken at the beginning of Week 17 for all years of last 10 years were winners, except for the year 2022. Please see the section of the detailed report below.
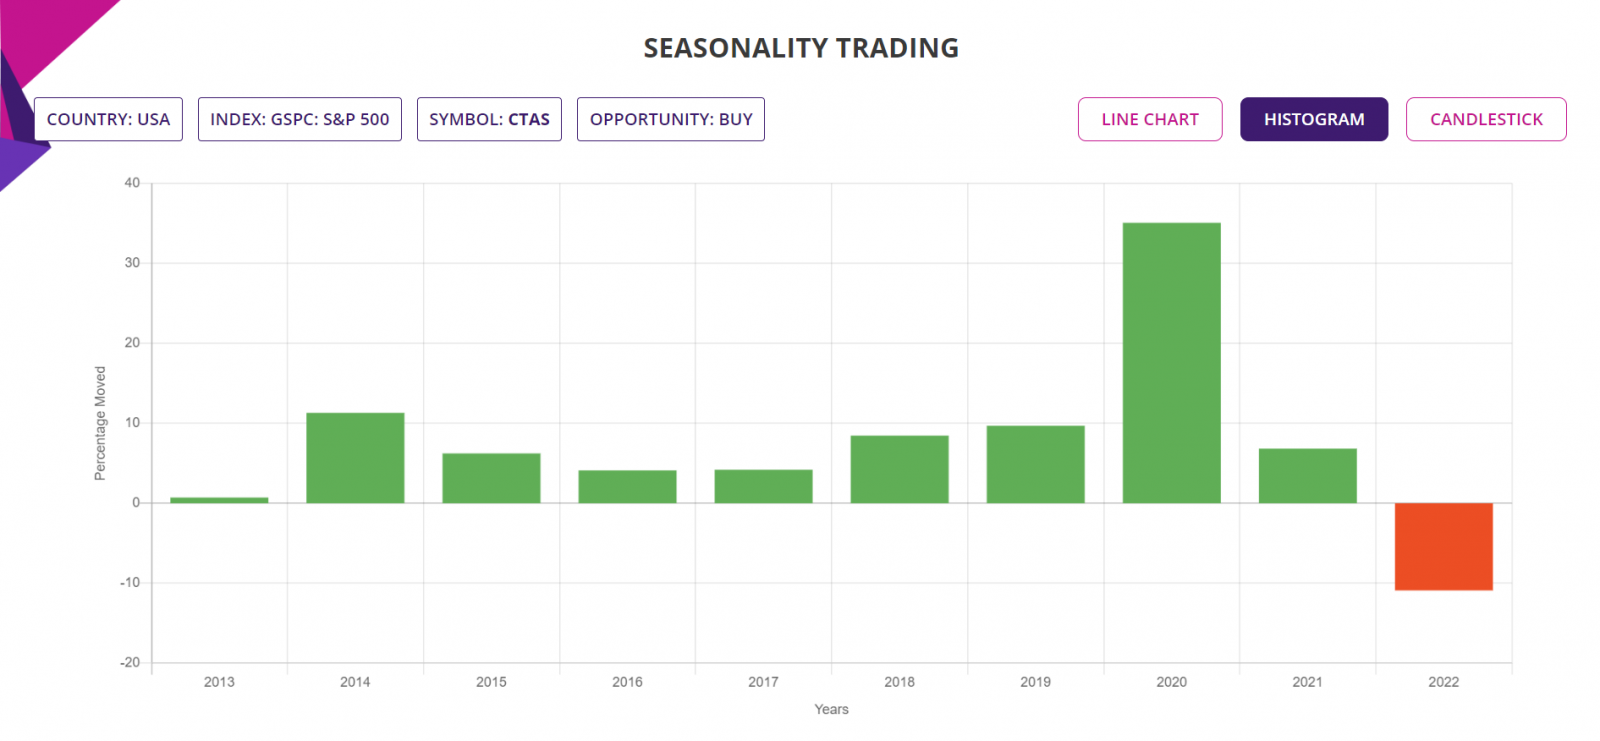
Histogram Chart: The chart below shows the percentage moves of the underlying Stock of Interest in each of the years in the Seasonality analysis, for a quick visual clue of the year-by-year trade performance. There was only one RED bar in the histogram showing the loss in 2022 in last 10 years.
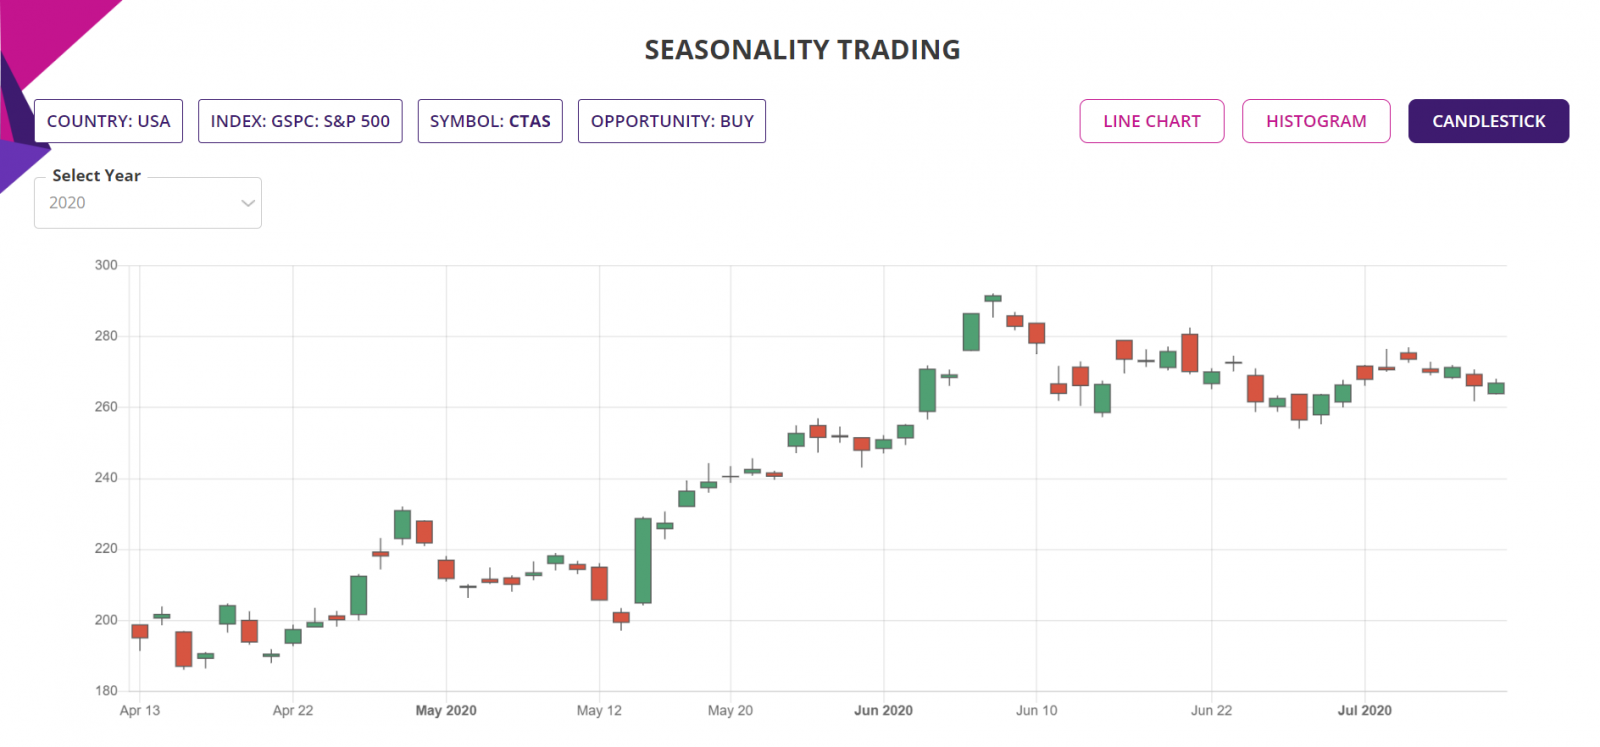
Candlestick Chart: The candlestick chart of the underlying Stock/ETF’s latest performance in year 2021 is as shown below. In the web-based Seasonality trading application, the chart is available for all the years of the Seasonality analysis, in this case, all of the last 10 years.
Trade Structure:
If we had traded the Stock this week, then we would have structured the trade as CFD as follows:
|
TRADE STRUCTURE (All prices in United States Dollars or USD) |
||
|
Stock price |
$459.87 |
USD |
|
CFDs |
1,000 |
Number of Stocks used for this CFD trde |
|
CFD Margin |
5% |
CFD leverage |
|
|
|
|
|
Margin |
$22,993.50 |
Amount of fund required for the trade |
|
|
|
|
|
Target Stock price |
$505.86 |
10% above the current price, limit order placed at this underlying price |
|
Stop Stock price |
$443.77 |
3% below the current price, guaranteed stop at this price |
|
|
|
|
|
Profit Target |
$45,987.00 |
|
|
Stop Loss |
$16,095.45 |
|
|
RRR |
2.86 |
|
|
RoI |
200% |
Potential return of investment |
The choice of RRR of 2.86:1 is in line with the average RRR from the last 10 trades in each of the last 10 years in Week 17, since 2013 till 2022.
Please note that the potential RoI or Return on Investment is 200% minus commissions and any other applicable brokerage fees, since the trade is structured as CFD. Please note that in CFD trade, there will be additional interests payable for the days the CFD position is held apart from trading commissions or any other transaction costs.
Further Information about trading applications:
Please visit the following URL for more information on various trading applications from Sapphire Capitals which are designed to deliver high probability trading opportunities for swing trading as well as for intraday trading:
https://www.sapphirecapitals.com/pages/swing-trading-stock-seasonality-strategy/
https://www.sapphirecapitals.com/pages/swing-trading-stock-price-action-strategy/
https://www.sapphirecapitals.com/pages/swing-trading-volume-spike-stock-trading-strategy/
https://www.sapphirecapitals.com/pages/day-trading-intraday-seasonality-trading/
Disclaimer:
Sapphire Private Assets (ABN: 34 613 892 023, trading as Sapphire Capitals) is not a broker or a financial adviser but an education and research organisation; we provide training and tools for traders and DIY fund managers for trading in global financial markets. The contents of the blog have been produced by using technical analysis and trading applications developed by Sapphire Capitals for the Stock and ETF traded worldwide. The contents of this blog are intended for education and research purposes only and is not a recommendation or solicitation to invest in any Stock or ETF.
For more details, please visit www.sapphirecapitals.com/Disclaimer.


