
-
 Admin123 :
Admin - Sapphire Capitals
Admin123 :
Admin - Sapphire Capitals -
 Date :
2023-03-12
Date :
2023-03-12
Stock In Focus - Week 11 (2023) – BELGIUM – SEASONALITY TRADING STRATEGY
The week beginning Monday, the 13th March is Week 11 as per ISO numbering convention of the weeks of a year. Seasonality trading strategy involves studying Stocks and ETFs or any other underlying for strong seasonal behaviour so that we could trade the underlying in line with their seasonal behaviour for direction of the trade.
Country in focus:
This week we look at the Stocks from Belgium in BEL-20 index.
Stock/ETF in focus:
Specific Stock in focus Etn. Fr. Colruyt NV (Ticker: COLR). The Stock is listed in the Euronext Brussels Stock Exchange (or Bourse de Bruxelles/Beurs van Brussel), trading currency being Currency Euro or EUR in short.
Trade Direction:
BULLISH, Seasonality study for last 10 years reveal 90.0% probability of success in a BUY (LONG) trade for this week (Week 11) and 90% probability for the trade next week (Week 12). Please see the Summary report screenshot later in the blog.
Overview:
Etn. Fr. Colruyt NV, together with its subsidiaries, engages in the retail, wholesale, food service, and other activities in Belgium, France, and internationally. The company was founded in 1928 and is headquartered in Halle, Belgium.
The company operates through three segments: Retail, Wholesale and Foodservice, and Other Activities. The company operates CNG and hydrogen filling stations; provides printing and document management solutions; and develops, constructs, operates, and finances wind energy projects. In addition, the company provides fresh products, dry food, and frozen and non-food products. It provides its products and services to wholesalers, commercial customers, and affiliated independent merchants, as well as, schools, care homes, the hospitality sector, etc.
(Courtesy: Yahoo Finance)
Sector and Industry Details:
Sector(s): Consumer Defensive
Industry: Grocery Stores
Full Time Employees: 32,000
(Courtesy: Yahoo Finance)
Fundamentals:
52 Week Range 19.71 - 41.02
Avg. Volume 187,561
Market Cap 3.432B
PE Ratio (TTM) 15.60
EPS (TTM) 1.63
Earnings Date Dec 14, 2022
Ex-Dividend Date Sep 30, 2022
(Courtesy: Yahoo Finance)
Current trading price:
As of Friday, close of 19th March 2023, the stock was trading at 25.42. All prices are in EUR.
SEASONALITY:
The stock demonstrated very strong SEASONAL move in week 11 of the year, here are the details of its SEASONAL behaviour.
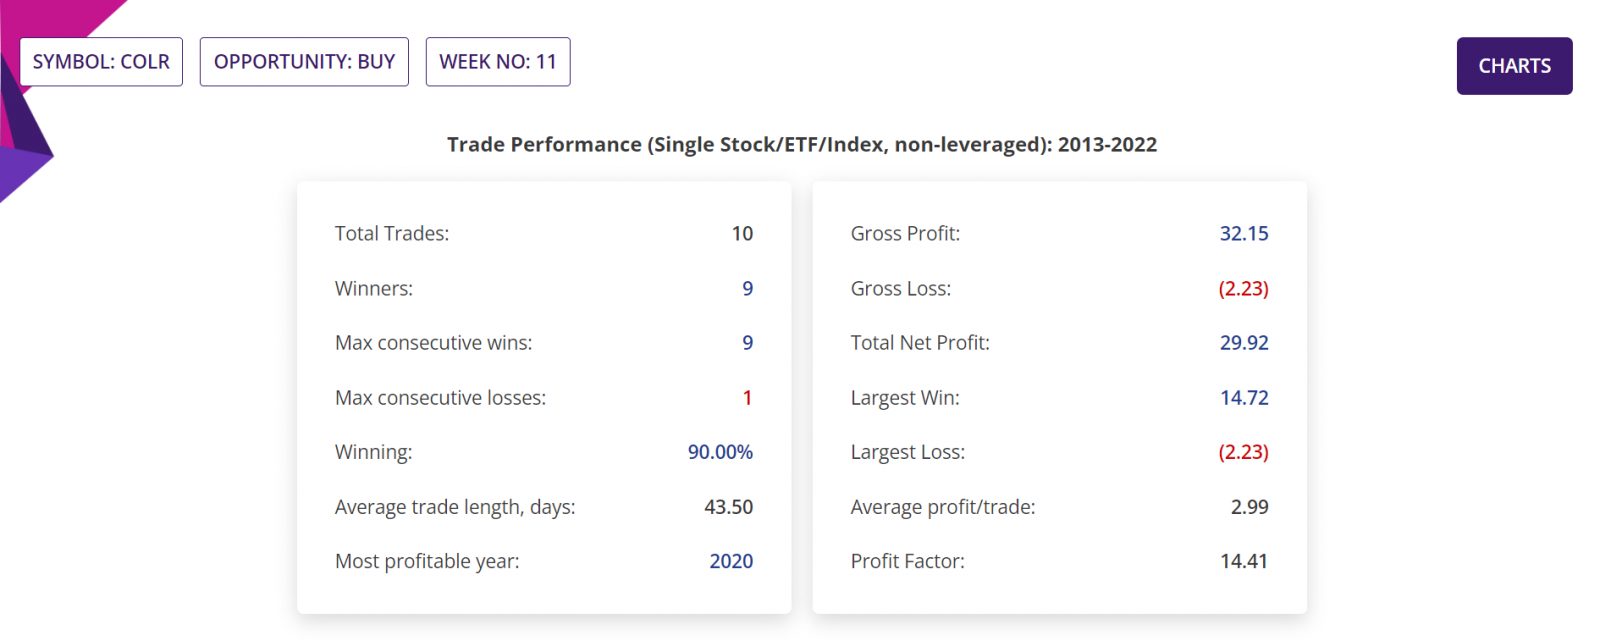
Summary report: In 9 out of last 10 years in week 11, the stock was BULLISH with average move up (AMU) of 8.91% and average move down (AMD) of 2.98% for an average holding time (ADH) of 44 days. The worst-case average Reward-Risk Ratio (RRR) for all 10 trades over last 10 years was 1.66:1. See the summary report table below:
.png)
.png)
Detailed Report, Trade Performance: If only 1,000 stocks were bought in the beginning of week 11 every year for last 10 years, then a trader would have had a Gross Profit of EUR32,150, Gross Loss of only EUR2,230, making a Total Net Profit of EUR29,920. No leverage applied.
In those 10 years, the Largest Win was EUR14,720, Largest Loss was EUR2,230, the Average profit/trade being EUR2,990. Profit factor (quotient of Gross Profit and Gross Loss) being 14.41. All figures gross and excluding trading commissions or any brokerage fees. Please see the section of the detailed report below.
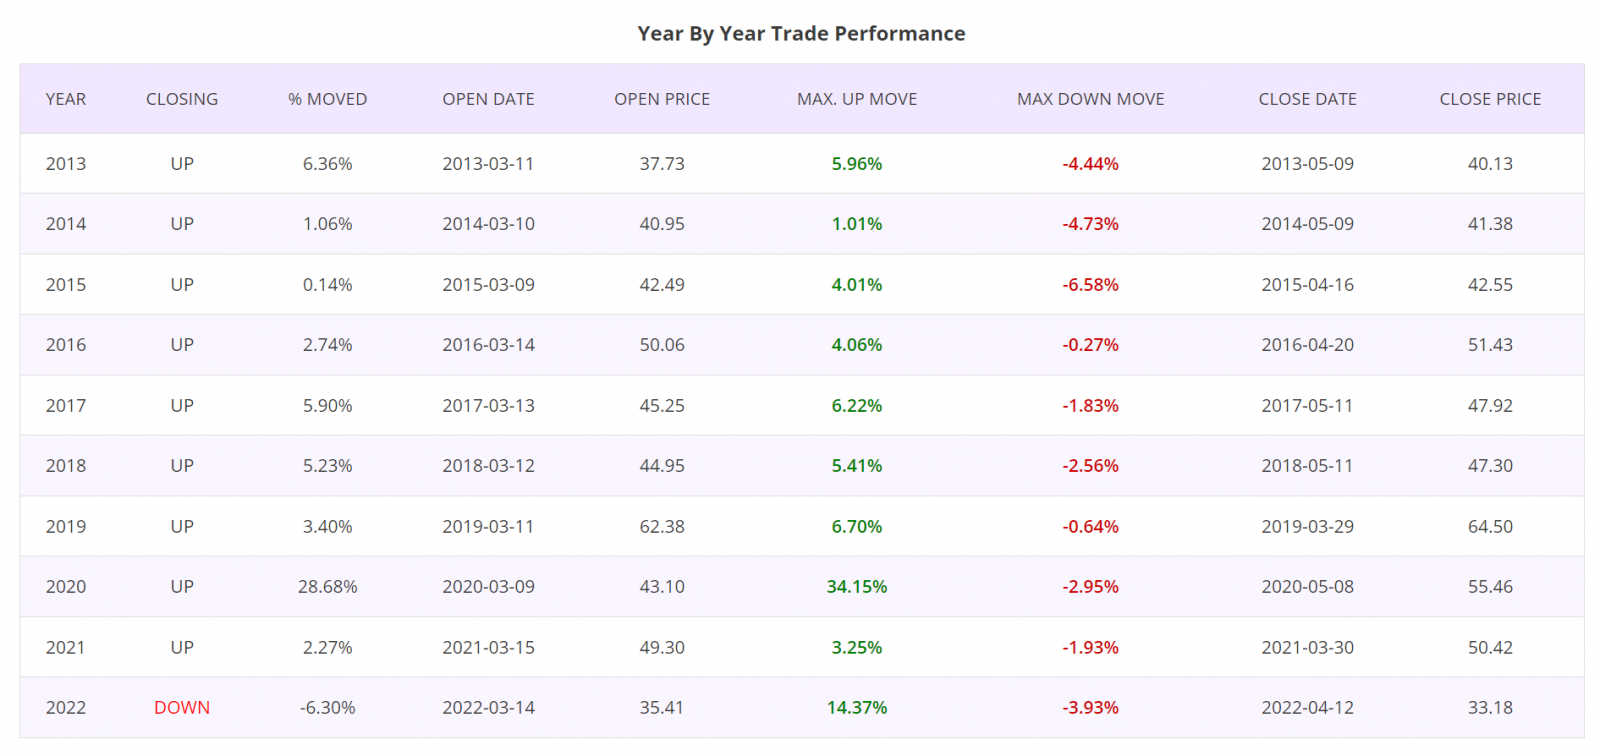
Detailed Report, Year by Year Trade Performance: Trades taken at the beginning of Week 11 for all years of last 10 years were winners, except for the year 2022 in which there was a very small loss. Please see the section of the detailed report below.
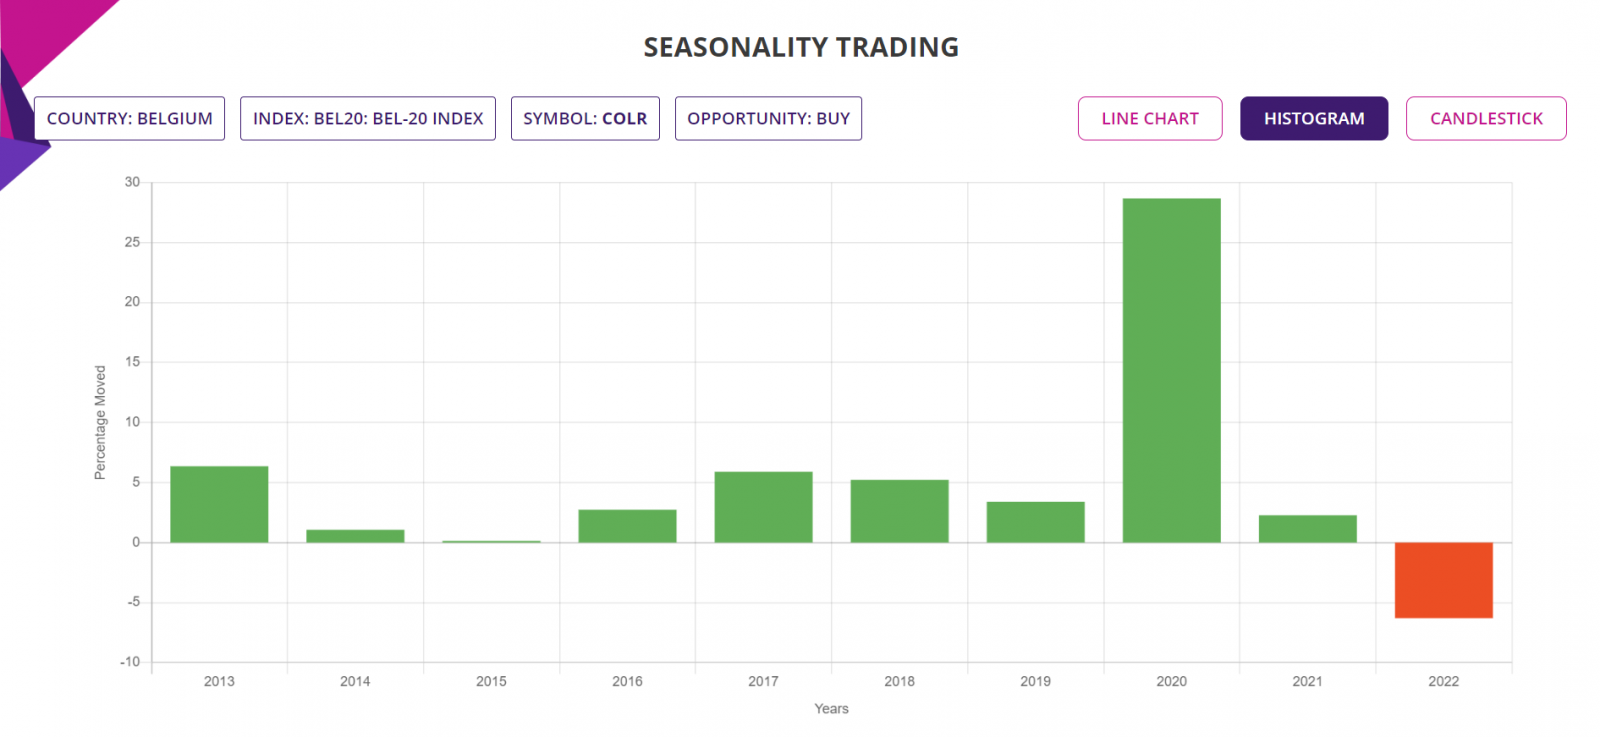
Histogram Chart: The chart below shows the percentage moves of the underlying Stock of Interest in each of the years in the Seasonality analysis, for a quick visual clue of the year-by-year trade performance. There is only one RED bar in the histogram showing the only loss in 2022 among last 10 years.
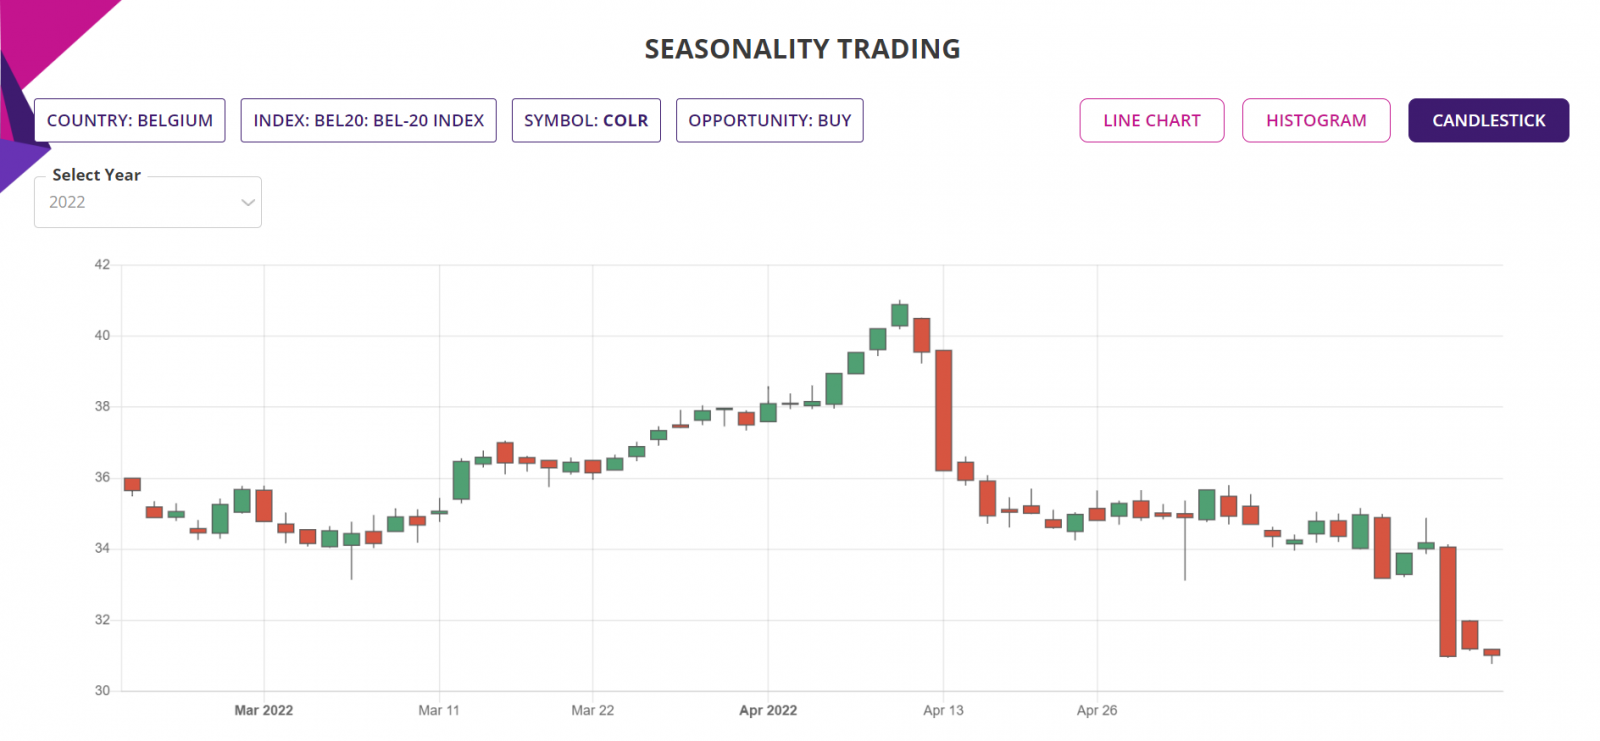
Candlestick Chart: The candlestick chart of the underlying Stock/ETF’s latest performance in year 2022 is as shown below. In the web-based Seasonality trading application, the chart is available for all the years of the Seasonality analysis, in this case, all of the last 10 years.
Trade Structure:
If we had traded the Stock this week, then we would have structured the trade as follows:
|
TRADE STRUCTURE (All prices in Euro or EUR) |
||
|
Stock price |
25.42 |
Assuming trade placed at last traded price |
|
Stocks |
1,000 |
Number of Stocks used for this trade |
|
Investment required |
25,420 |
Amount of fund required for the trade |
|
|
|
|
|
Target Stock price (TP) |
26.95 |
6% above the current price |
|
Stop Loss price (SL) |
24.66 |
3% below the current price |
|
|
|
|
|
Profit Target |
1,525 |
Limit order placed at underlying TP price |
|
Stop Loss |
763 |
Guaranteed stop at SL price |
|
Return on Investment (RoI) |
6.0% |
Not including trading commissions |
The choice of RRR of 2:1 is in line with the worst-case average RRR from the last 10 trades in each of the last 10 years in Week 11, since 2013 till 2022.
Please note that the RoI of return on investment is 6% minus commissions and any other applicable brokerage fees. In a CFD trade, the investment would have been much less, thus making the RoI much larger than what is shown here. But also in that case, there will be additional CFD interests payable for the days the CFD position is held.
Further Information about trading applications:
Please visit the following URL for more information on various trading applications from Sapphire Capitals which are designed to deliver high probability trading opportunities for swing trading as well as for intraday trading:
https://www.sapphirecapitals.com/pages/swing-trading-stock-seasonality-strategy/
https://www.sapphirecapitals.com/pages/swing-trading-stock-price-action-strategy/
https://www.sapphirecapitals.com/pages/swing-trading-volume-spike-stock-trading-strategy/
https://www.sapphirecapitals.com/pages/day-trading-intraday-seasonality-trading/
Disclaimer:
Sapphire Private Assets (ABN: 34 613 892 023, trading as Sapphire Capitals) is not a broker or a financial adviser but an education and research organisation; we provide training and tools for traders and DIY fund managers for trading in global financial markets. The contents of the blog have been produced by using technical analysis and trading applications developed by Sapphire Capitals for the Stock and ETF traded worldwide. The contents of this blog are intended for education and research purposes only and is not a recommendation or solicitation to invest in any Stock or ETF.
For more details, please visit www.sapphirecapitals.com/Disclaimer.


