
-
 Admin123 :
Admin - Sapphire Capitals
Admin123 :
Admin - Sapphire Capitals -
 Date :
2023-03-05
Date :
2023-03-05
Stock of interest - Week 10 (2023) – INDIA – PRICE ACTION TRADING STRATEGY
The week beginning Monday, the 6th March is Week 10 as per ISO numbering convention of the weeks of a year.
Country in focus:
This week we look at the Stocks from INDIA in NIFTY 500 index. The index is India’s first broad-based stock market index of the Indian stock market. It contains top 500 listed companies on the National Stock Exchange (NSE). The NIFTY 500 index represents about 96.1% of free float market capitalization and about 96.5% of the total turnover on the NSE.
Stock/ETF in focus:
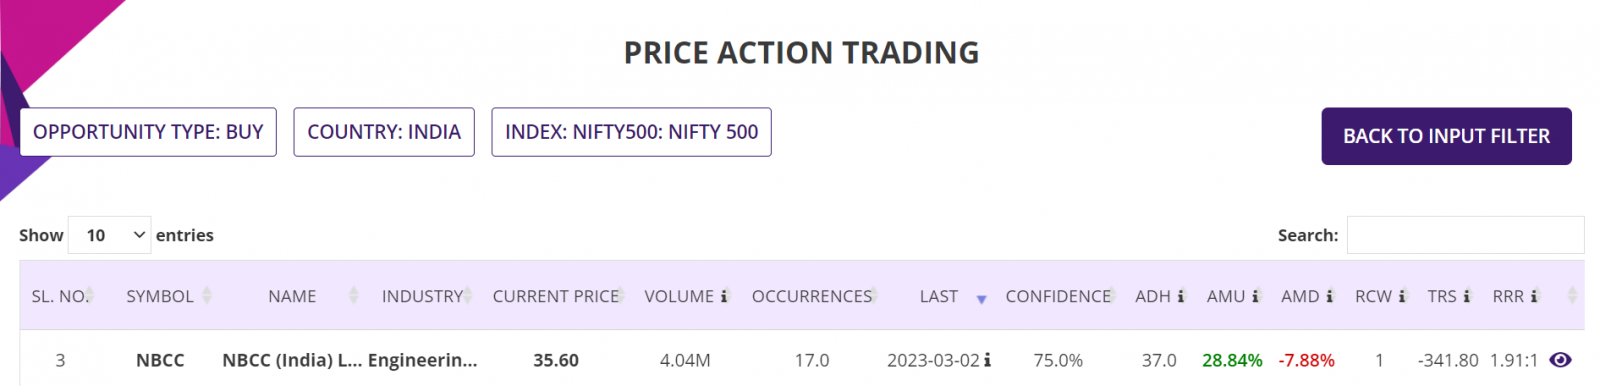
Specific Stock in focus is NBCC (India) Limited (Ticker: NBCC). The trading currency is Indian Rupees or INR.
Trade Direction:
BULLISH, Price Action study since 2020 reveal 75% probability of success with historical worst-case RRR of over 1.91:1 in all completed BUY (LONG) trade.
Most Recent Event: Most recent Price Action event was on Thursday, the 2nd March. Preferred trade opening is the next market open day on Friday, the 3rd March or Monday, the 6th March.
Overview:
NBCC (India) Limited engages in project management consultancy and real estate development businesses in India and internationally. The company was formerly known as National Buildings Construction Corporation Limited and changed its name to NBCC (India) Limited in May 2016. NBCC (India) Limited was incorporated in 1960 and is headquartered in New Delhi, India.
The company operates through three segments: Project Management Consultancy (PMC); Engineering Procurement and Construction (EPC); and Real Estate Development. The PMC segment provides services for various civil construction projects, including residential and commercial complexes, re-development of colonies, hospitals, educational institutions, infrastructure works for security personnel, and border fencing projects, as well as infrastructure projects, such as roads, water supply systems, storm water drainage systems, water storage solutions, and solid waste management schemes. The EPC segment executes various projects, which include chimneys, cooling towers, coal handling plants, roads, TV towers, airports, runways, etc.; and project conceptualization, feasibility studies, detailed project reports, engineering, tender specifications and packages covering basic and detailed engineering, review of projects, procurement, construction drawings, commissioning, testing, and handing projects services. The Real Estate Development segment develops residential, commercial, and institutional projects. It is also involved in the provision of post-construction maintenance services; implementation of integrated steel plants; consultancy services in the field of hospital planning, design, detail engineering, quality control, project management, and monitoring, as well as procurement, supply, installation, and commissioning of medical equipment; construction, real estate, and project management consultancy; and environment and sustainability business.
(Courtesy: Yahoo Finance)
Sector and Industry Details:
Sector(s): Industrials
Industry: Engineering & Construction
Full Time Employees: 1,367
(Courtesy: Yahoo Finance)
Fundamentals:
52 Week Range 26.55 - 43.75
Volume 4,040,986
Market Cap 64.08B
Beta (5Y Monthly) 1.35
PE Ratio (TTM) 30.96
EPS (TTM) 1.15
Ex-Dividend Date Sep 01, 2022
(Courtesy: Yahoo Finance)
Current trading price:
As of Thursday, the 2nd March 2023, or the day the Price Action event took place, the stock closed at 36.20. The last closing price on Friday, the 3rd March was 35.60.
PRICE ACTION:
The Stock was Bullish 75% of the time following Bullish Price action events since the beginning of 2020. Here is the key Price Action event performance of the Stock:
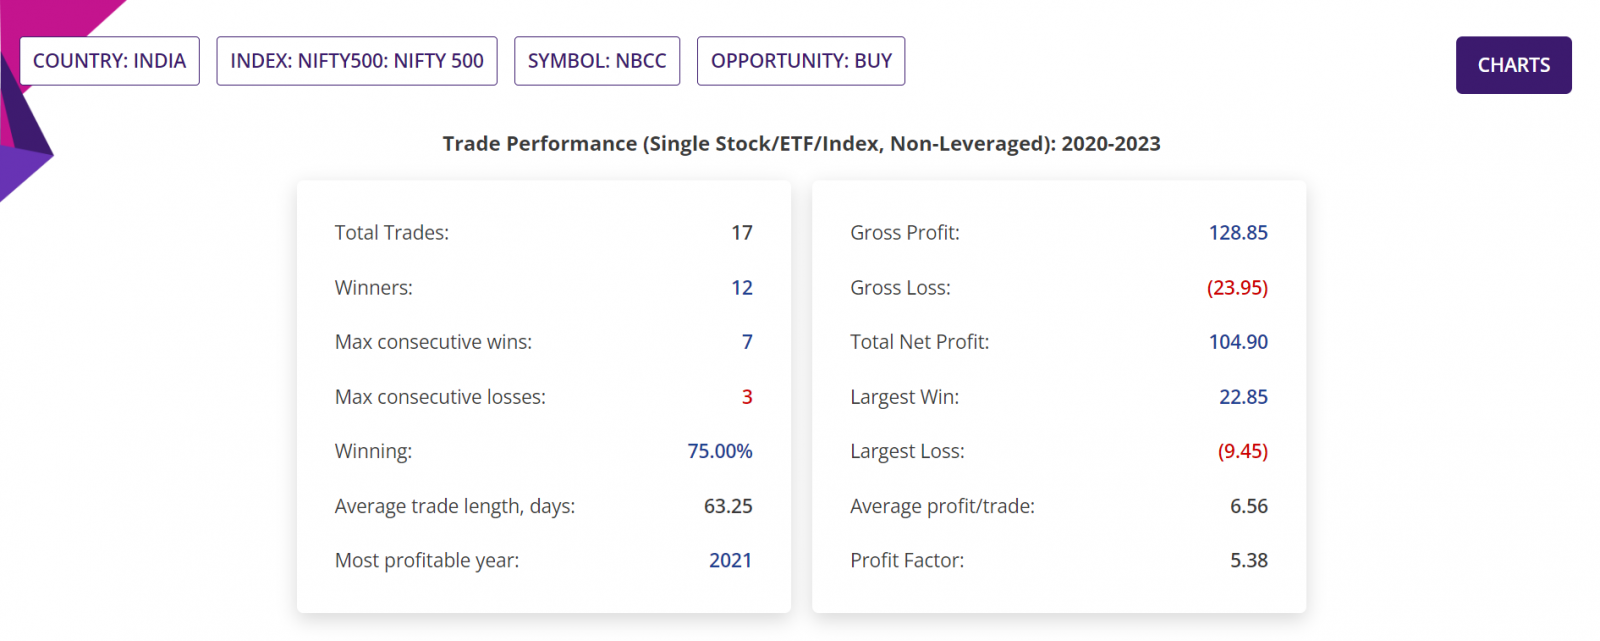
Summary report: Since beginning of 2020, there were 17 BULLISH Price action events, of which one event is yet to be traded, that is the current Bullish trading opportunity being discussed in this blogpost. These leaves 16 completed trades, of which 12 were winners (and hence 75% confidence or Probability) with average move up (AMU) of 28.84% and average move down (AMD) of 7.88% for an average holding time (ADH) of about 37 days.
Historical RRR in those completed trades was 1.91:1. Please note that RRR shown here is a worst-case scenario, as many trades could be closed sooner with higher profit compared to trades closed at the end of 9-week period.
Detailed Report, Trade Performance: If 1,000 stocks were bought following those BULLISH Price action events, then a trader would have had a Gross Profit of INR1,28,850, Gross Loss of INR23,950, making a Total Net Profit of INR1,04,900. In those closed trades, the Largest Win was INR22,850, Largest Loss is INR9,450, the Average profit/trade being INR6,560. All figures above are in Indian Rupees.
The Profit Factor (which is quotient of Gross Profit and Gross Loss) in those trades was 5.38.
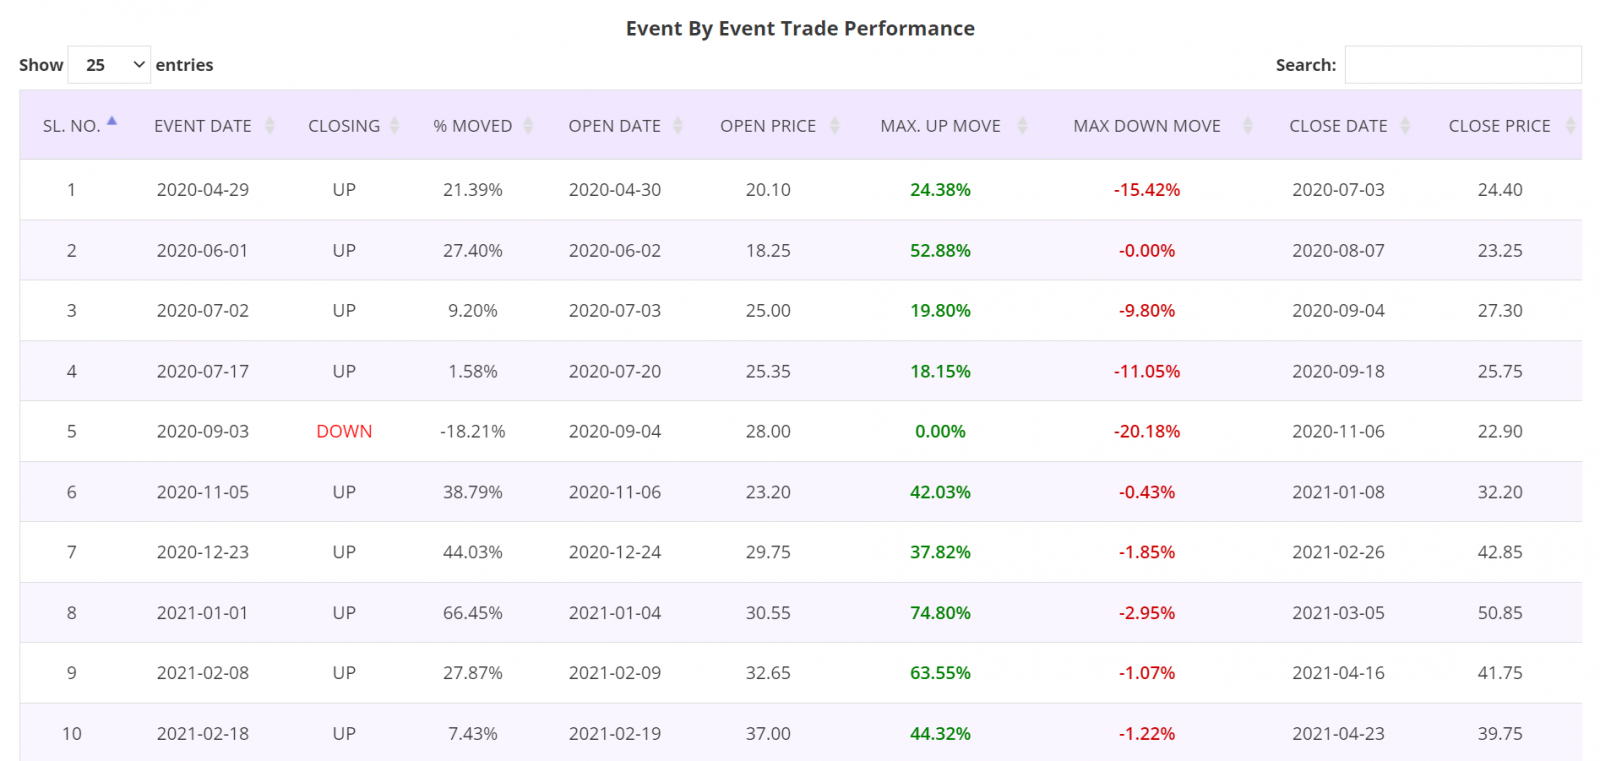
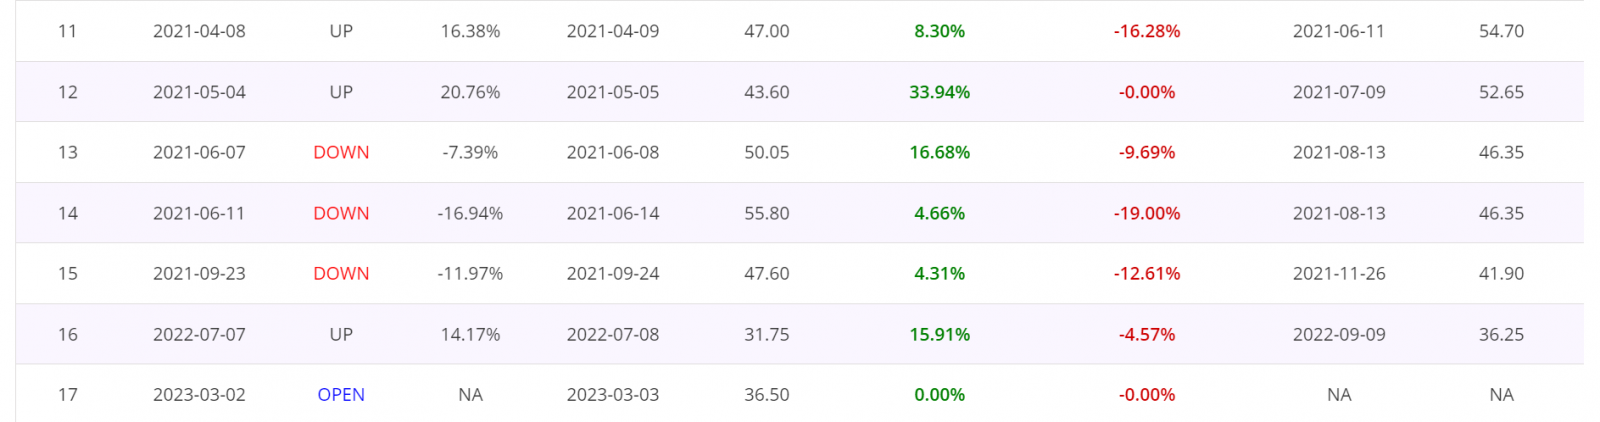
Detailed Report, Trade by Trade Performance: Results of each trade taken following the Price Action events since the beginning of 2020 are as shown in the table below. As can been seen in the table, 10 trades were winners and four losers. These tables are from the Detailed report of the Price Action trading app.
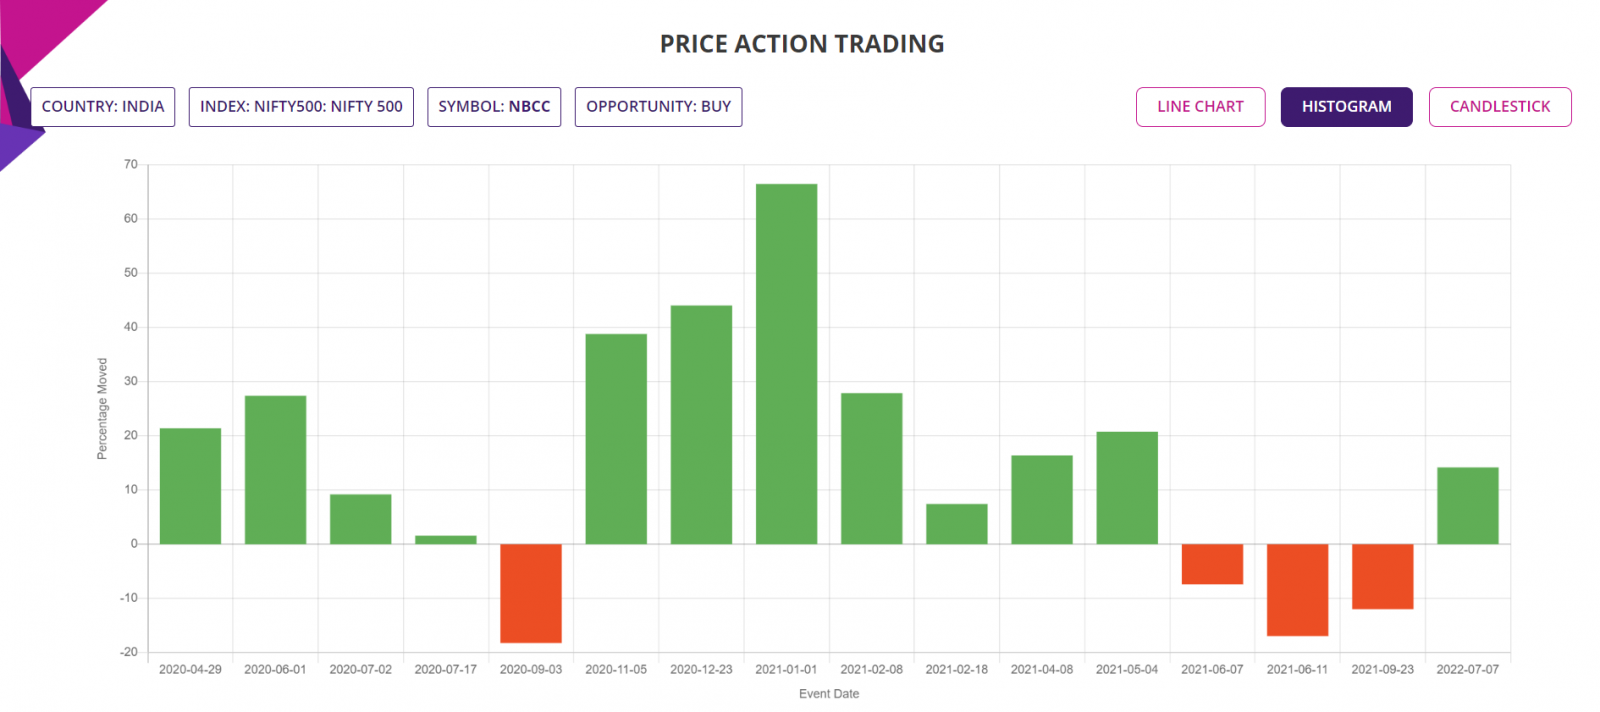
Histogram Chart: The chart below shows the percentage moves of the underlying Stock of Interest following each Price Action event for the period of analysis mentioned earlier, for a quick visual clue of the trade-by-trade performance.
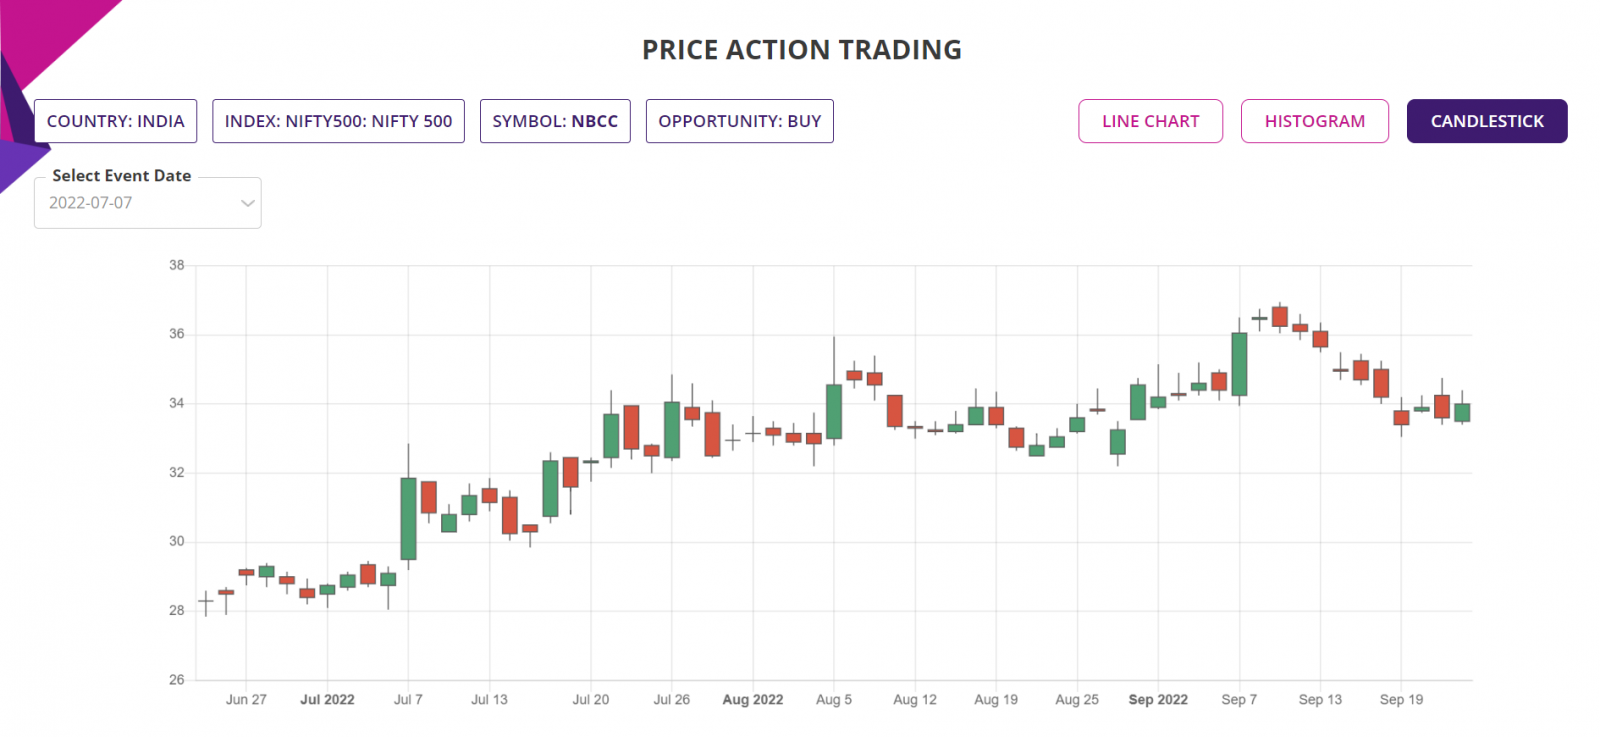
Candlestick Chart: The candlestick chart of the underlying Stock/ETF’s latest performance is as shown below. In the web-based Price Action trading app, the chart is available for all the price action events since the year in the “Data since” in the input filter page.
Trade Structure:
If we had traded the Stock this week, then we would have structured the trade as follows:
|
TRADE STRUCTURE (All prices in Indian Rupees or INR) |
||
|
Stock price |
35.60 |
Assuming trade placed at last traded price |
|
Stocks |
1,000 |
Number of Stocks used for this trade |
|
Investment required |
35,600 |
Amount of fund required for the trade |
|
|
|
|
|
Target Stock price (TP) |
41.30 |
16% above the current price |
|
Stop Stock price (SL) |
32.75 |
8% below the current price |
|
|
|
|
|
Profit Target |
5,696 |
Limit order placed at underlying TP price |
|
Stop Loss |
2,848 |
Guaranteed stop at SL price |
Further Information about trading applications:
Please visit the following URL for more information on various trading applications from Sapphire Capitals which are designed to deliver high probability trading opportunities for swing trading as well as for intraday trading:
https://www.sapphirecapitals.com/pages/swing-trading-stock-seasonality-strategy/
https://www.sapphirecapitals.com/pages/swing-trading-stock-price-action-strategy/
https://www.sapphirecapitals.com/pages/swing-trading-volume-spike-stock-trading-strategy/
https://www.sapphirecapitals.com/pages/day-trading-intraday-seasonality-trading/
Disclaimer:
Sapphire Private Assets (ABN: 34 613 892 023, trading as Sapphire Capitals) is not a broker or a financial adviser but an education and research organisation; we provide training and tools for traders and DIY fund managers for trading in global financial markets. The contents of the blog have been produced by using technical analysis and trading applications developed by Sapphire Capitals for the Stock and ETF traded worldwide. The contents of this blog are intended for education and research purposes only and is not a recommendation or solicitation to invest in any Stock or ETF.
For more details, please visit www.sapphirecapitals.com/Disclaimer.


