
-
 Admin123 :
Admin - Sapphire Capitals
Admin123 :
Admin - Sapphire Capitals -
 Date :
2023-02-26
Date :
2023-02-26
Stock In Focus - Week 9 (2023) – CANADA – SEASONALITY TRADING STRATEGY
The week beginning Monday, the 27th February is Week 9 as per ISO numbering convention of the weeks of a year. Seasonality trading strategy involves studying Stocks or ETFs or any other underlying that have demonstrated strong seasonal behaviours so that we could find suitable underlying to trade and direction of the trade.
Country in focus:
This week we look at the Stocks from Canada in S&P TSX COMPOSITE index.
Stock/ETF in focus:
Specific Stock in focus Dollarama Inc. (Ticker: DOL). The Stock is listed in the Toronto Stock Exchange (TSX), trading currency being Currency Canadian Dollars or CAD.
Trade Direction:
BULLISH, Seasonality study for last 10 years reveal 90.0% probability of success in a BUY (LONG) trade for this week and 90% probability for the trade next week (Week 10). Please see the Summary report screenshot later in the blog.
Overview:
Dollarama Inc. operates a chain of dollar stores in Canada. Dollarama Inc. was founded in 1992 and is headquartered in Montreal, Canada.
Its stores offer general merchandise, consumables, and seasonal products. The company also sells its products through online store. The company was formerly known as Dollarama Capital Corporation and changed its name to Dollarama Inc. in September 2009.
(Courtesy: Yahoo Finance)
Sector and Industry Details:
Sector(s): Consumer Defensive
Industry: Discount Stores
Full Time Employees: Around 20,000 (2016)
(Courtesy: Yahoo Finance)
Fundamentals:
52 Week Range 64.28 - 85.88
Avg. Volume 703,560
Market Cap 22.796B
Beta (5Y Monthly) 0.75
PE Ratio (TTM) 30.76
EPS (TTM) 2.58
Earnings Date Mar 28, 2023 - Apr 03, 2023
Forward Dividend & Yield 0.22 (0.28%)
Ex-Dividend Date Jan 05, 2023
(Courtesy: Yahoo Finance)
Current trading price:
As of Friday, close of 24th February 2023, the stock was trading at 79.36. All prices are in CAD.
SEASONALITY:
The stock demonstrated very strong SEASONAL move in week 9 of the year, here are some of the details of its SEASONAL behaviour.
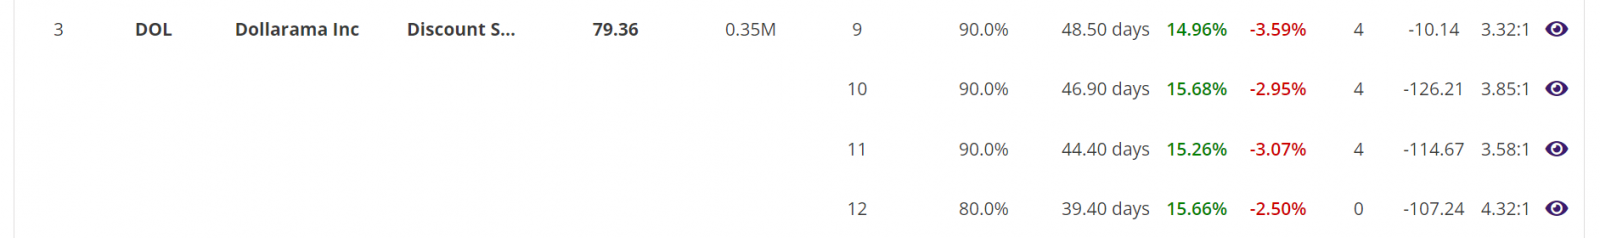
Summary report: In 9 out of last 10 years in week 9, the stock was BULLISH with average move up (AMU) of 14.96% and average move down (AMD) of 3.59% for an average holding time (ADH) of 49 days. The worst-case average Reward-Risk Ratio (RRR) for all 10 trades over last 10 years was 3.32:1. See the summary report table below:

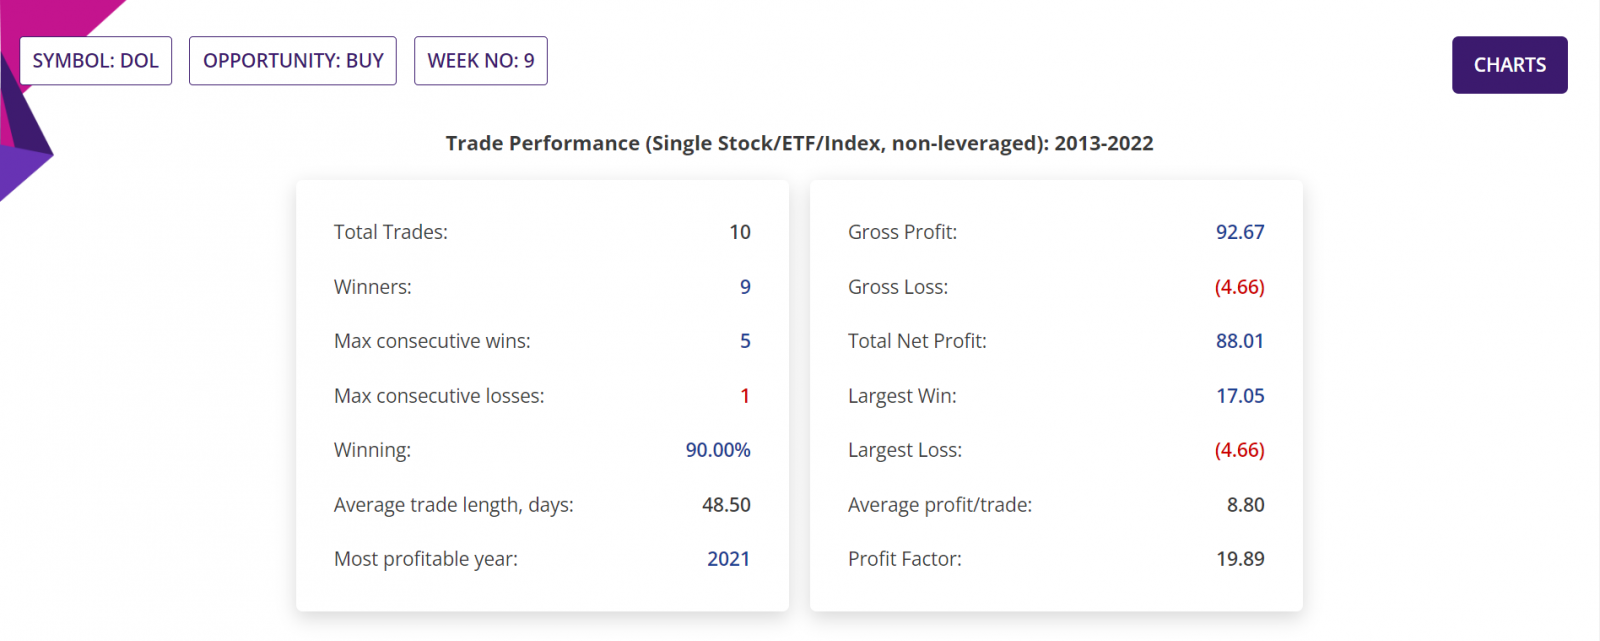
Detailed Report, Trade Performance: If only 1,000 stocks were bought in the beginning of week 9 every year for last 10 years, then a trader would have had a Gross Profit of CAD92,670, Gross Loss of only CAD4,660, making a Total Net Profit of CAD88,010. No leverage applied.
In those 10 years, the Largest Win was CAD17,050, Largest Loss was CAD4,660, the Average profit/trade being CAD8,800. Profit factor (quotient of Gross Profit and Gross Loss) being 19.89. All figures excluding trading commissions. Please see the section of the detailed report below.
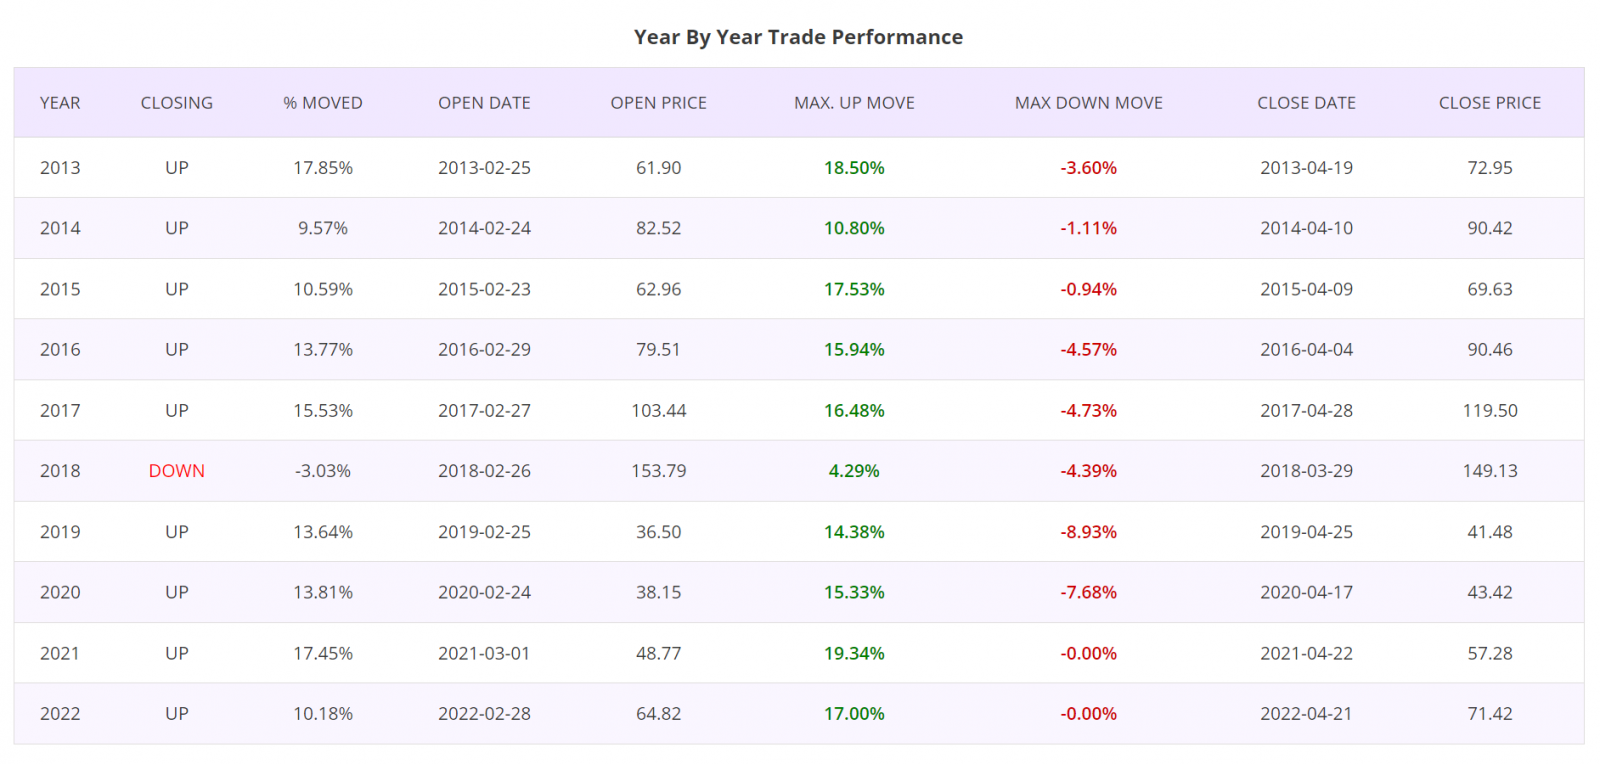
Detailed Report, Year by Year Trade Performance: Trades taken at the beginning of Week 9 for all years of last 10 years were winners, except for the year 2018 in which there was a very small loss. Please see the section of the detailed report below.
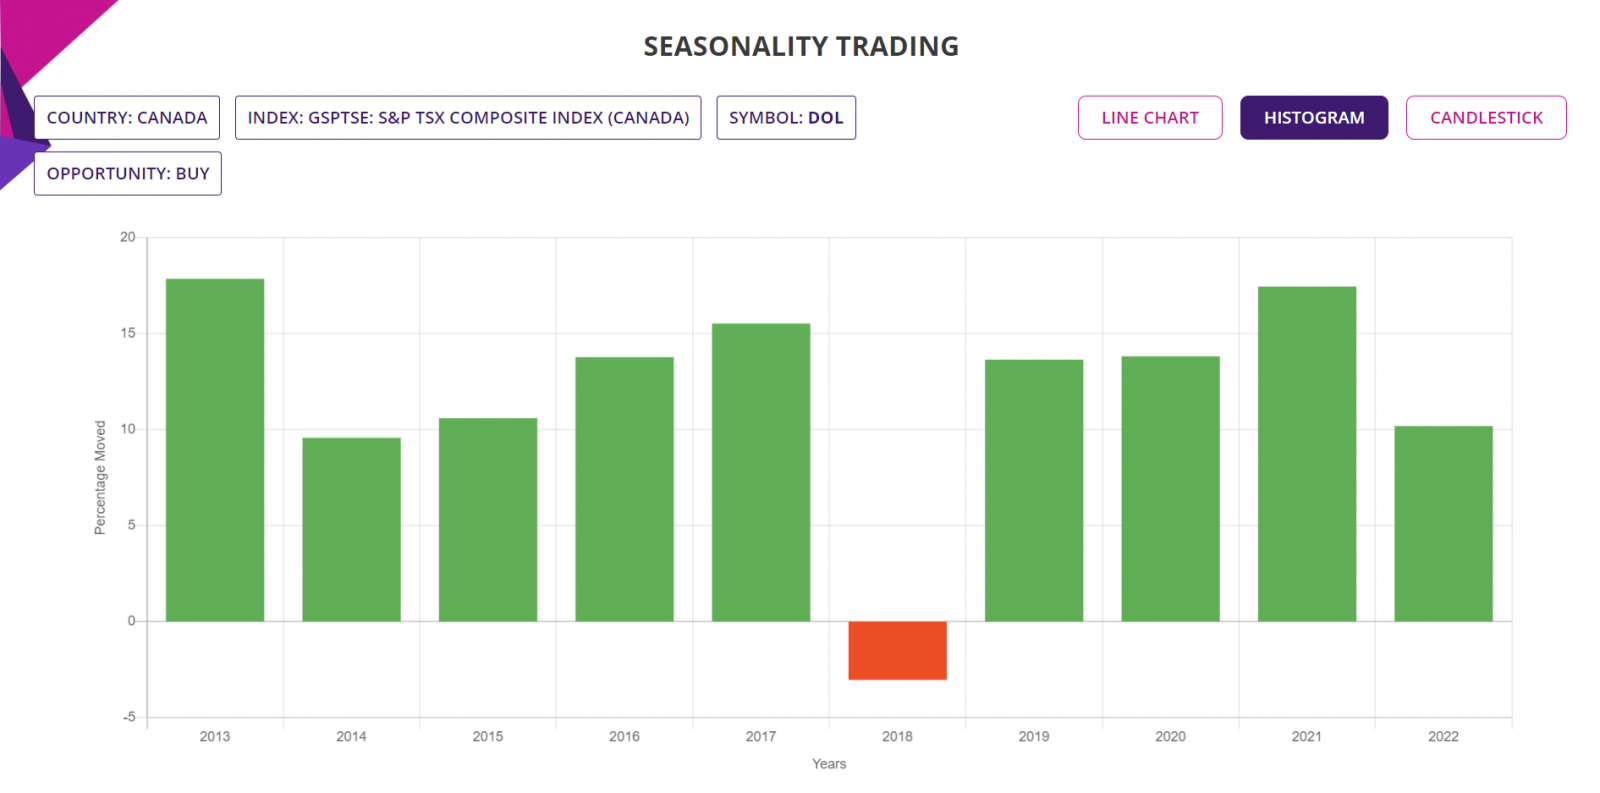
Histogram Chart: The chart below shows the percentage moves of the underlying Stock of Interest in each of the years in the Seasonality analysis, for a quick visual clue of the year-by-year trade performance. There is only one RED bar in the histogram showing the only loss in 2018 among last 10 years.
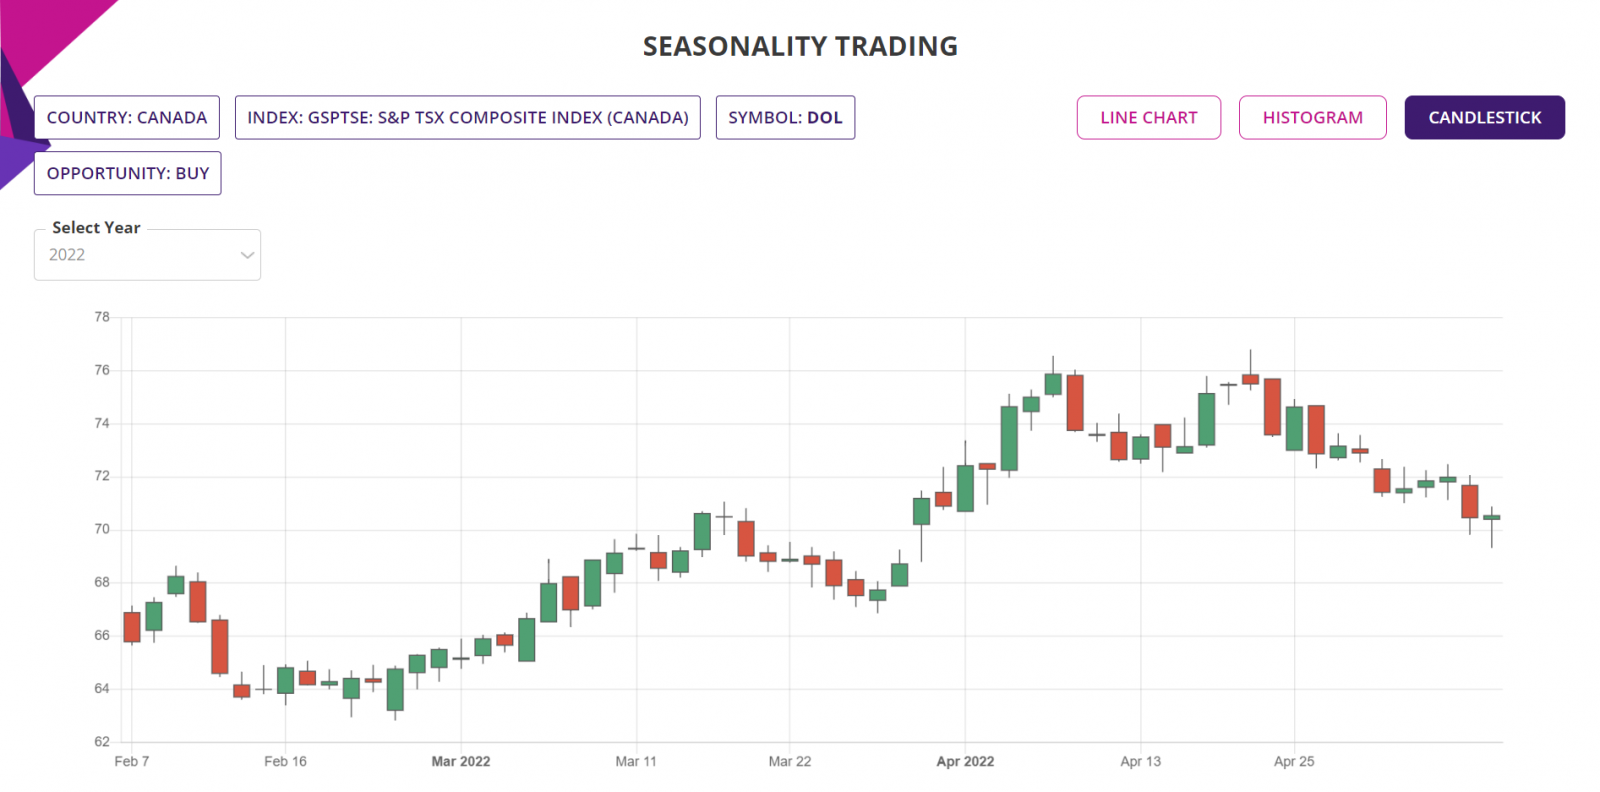
Candlestick Chart: The candlestick chart of the underlying Stock/ETF’s latest performance in year 2022 is as shown below. In the web-based Seasonality trading application, the chart is available for all the years of the Seasonality analysis, in this case, all of the last 10 years.
Trade Structure:
If we had traded the Stock this week, then we would have structured the trade as CFD trade and as follows:
|
TRADE STRUCTURE (All prices in Canadian Dollar or CAD) |
||
|
Stock price |
79.36 |
Assuming trade placed at last traded price |
|
Stocks |
1,000 |
Number of Stocks used for this trade |
|
Value of Stock purchase |
79,360 |
|
|
|
|
|
|
CFD leverage |
20% |
|
|
Investment required |
15,872 |
Amount of fund required for the CFD trade |
|
|
|
|
|
Target Stock price (TP) |
87.30 |
10% above the current price |
|
Stop Stock price (SL) |
76.98 |
3% below the current price |
|
|
|
|
|
Profit Target |
7,936 |
Limit order placed at underlying TP price |
|
Stop Loss |
2,381 |
Guaranteed stop at SL price |
|
Potential RoI |
50% |
Excluding commissions & CFD interest |
The choice of RRR of 3.33:1 is in line with the worst-case average RRR from the last 10 trades in each of the last 10 years in Week 9, since 2013 till 2022.
Please note that the RoI of return on investment is 50% minus commissions and CFD interests etc. Canada has a very liquid Options market. So, an Options trade such as debit or credit spread can take advantage of the potential bullish move of the underlying Stock and can dramatically increase the RoI in the vicinity of 200% to 300% and correspondingly reduce the trading capital at risk.
Further Information about trading applications:
Please visit the following URL for more information on various trading applications from Sapphire Capitals which are designed to deliver high probability trading opportunities for swing trading as well as for intraday trading:
https://www.sapphirecapitals.com/pages/swing-trading-stock-seasonality-strategy/
https://www.sapphirecapitals.com/pages/swing-trading-stock-price-action-strategy/
https://www.sapphirecapitals.com/pages/swing-trading-volume-spike-stock-trading-strategy/
https://www.sapphirecapitals.com/pages/day-trading-intraday-seasonality-trading/
Disclaimer:
Sapphire Private Assets (ABN: 34 613 892 023, trading as Sapphire Capitals) is not a broker or a financial adviser but an education and research organisation; we provide training and tools for traders and DIY fund managers for trading in global financial markets. The contents of the blog have been produced by using technical analysis and trading applications developed by Sapphire Capitals for the Stock and ETF traded worldwide. The contents of this blog are intended for education and research purposes only and is not a recommendation or solicitation to invest in any Stock or ETF.
For more details, please visit www.sapphirecapitals.com/Disclaimer.


