
-
 Admin123 :
Admin - Sapphire Capitals
Admin123 :
Admin - Sapphire Capitals -
 Date :
2023-02-12
Date :
2023-02-12
Stock of interest - Week 7 (2023) – AUSTRALIA – PRICE ACTION TRADING STRATEGY
The week beginning Monday, the 13th February is Week 7 as per ISO numbering convention of the weeks of a year.
This week, we look at Price Action trading app to find out Stocks/ETFs of interest. The Price Action trading app uses three key price action parameters such as trend, momentum and trading volume in a proprietary algorithm to find out Stocks/ETFs which are set up to make large bullish or bearish moves over a swing trading period.
Country in focus:
This week we look at the Stocks from AUSTRALIA in AXJO: S&P/ASX 200 index.
Stock/ETF in focus:
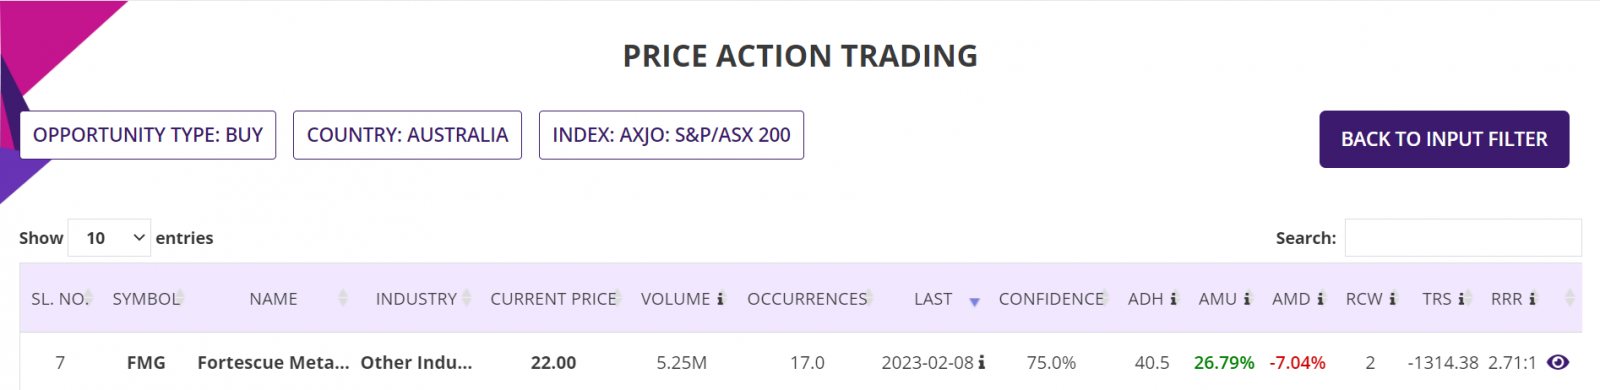
Specific Stock in focus is Fortescue Metals Group Limited (Ticker: FMG). The trading currency is Australian Dollar or AUD.
Trade Direction:
BULLISH, Price Action study since 2020 reveal 75.0% probability of success with historical worst-case RRR of over 2.71:1 in all completed BUY (LONG) trades.
Most Recent Event: Most recent Price Action event was on Wednesday, the 8th February. Preferred trade opening is the next market open day on Thursday, the 9th February. But since, the blog is being written over the weekend, the opportunity can also be traded on Monday, the 13th February.
Overview:
Fortescue Metals Group Limited engages in the exploration, development, production, processing, and sale of iron ore in Australia, China, and internationally. Fortescue Metals Group Limited was incorporated in 1983 and is headquartered in East Perth, Australia.
It also explores for copper and gold deposits. The company owns and operates the Chichester Hub that includes the Cloudbreak and Christmas Creek mines located in the Chichester ranges; and the Solomon Hub comprising the Firetail, Kings Valley, and Queens Valley mines located in the Hamersley ranges of Pilbara, Western Australia. It is also developing the Eliwana mine situated in the Pilbara region of Western Australia. In addition, the company holds a portfolio of properties situated in Ecuador, Argentina, Colombia, Peru, Chile, and Brazil, as well as Portugal and Kazakhstan. Further, it provides port towage services.
(Courtesy: Yahoo Finance)
Sector and Industry Details:
Sector(s): Basic Materials
Industry: Other Industrial Metals & Mining
Full Time Employees: 11,693
(Courtesy: Yahoo Finance and FMG corporate website)
Fundamentals:
52 Week Range 14.50 - 23.25
Avg. Volume 7,295,343
Market Cap 67.737B
PE Ratio (TTM) 7.59
EPS (TTM) 2.90
Earnings Date Feb 15, 2023
Ex-Dividend Date Sep 05, 2022
(Courtesy: Yahoo Finance)
Current trading price:
As of Wednesday, the 8th February 2023, or the day the Price Action event took place, the stock closed at 22.48. The last closing price on Friday, the 10th February was 22.00.
PRICE ACTION:
The Stock was Bullish 75% of the time following Bullish Price action events since the beginning of 2020. Here is the key Price Action event performance of the Stock:
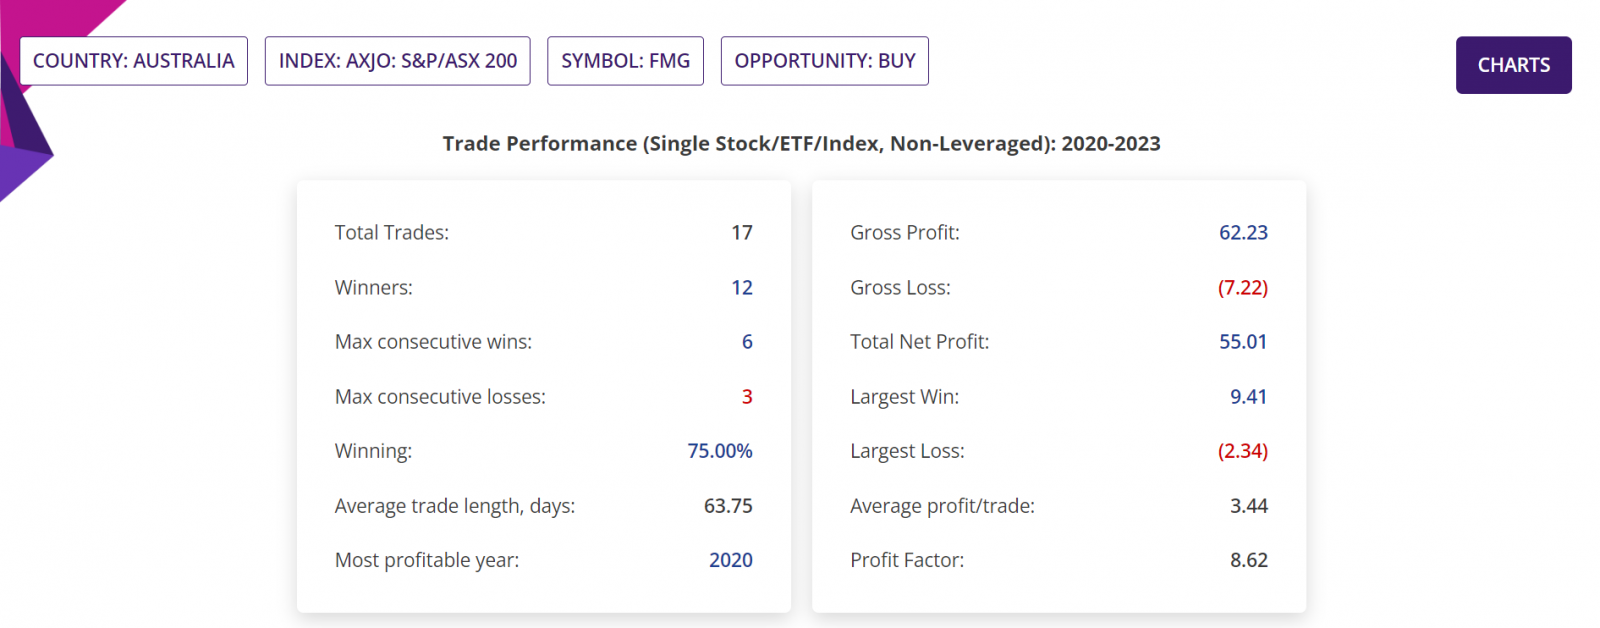
Summary report: Since beginning of 2020, there were 17 BULLISH Price action events, of which one event is yet to be traded, that is the current Bullish trading opportunity being discussed in this blogpost. These leaves 16 completed trades, of which 12 were winners (and hence 75% confidence or Probability) with average move up (AMU) of 26.79% and average move down (AMD) of 7.04% for an average holding time (ADH) of about 41 days.
Historical RRR in those completed trades was 2.71:1. Please note that RRR shown here is a worst-case scenario, as many trades could be closed sooner with higher profit compared to trades closed at the end of 9-week period.
Detailed Report, Trade Performance: If 1,000 stocks were bought following those BULLISH Price action events, then a trader would have had a Gross Profit of $62,230, Gross Loss of $7,220, making a Total Net Profit of $55,010. In those closed trades, the Largest Win was $9,410, Largest Loss is $2,340, the Average profit/trade being $3,440. All figures above are in AUD.
The Profit Factor (which is quotient of Gross Profit and Gross Loss) in those trades was 8.62.
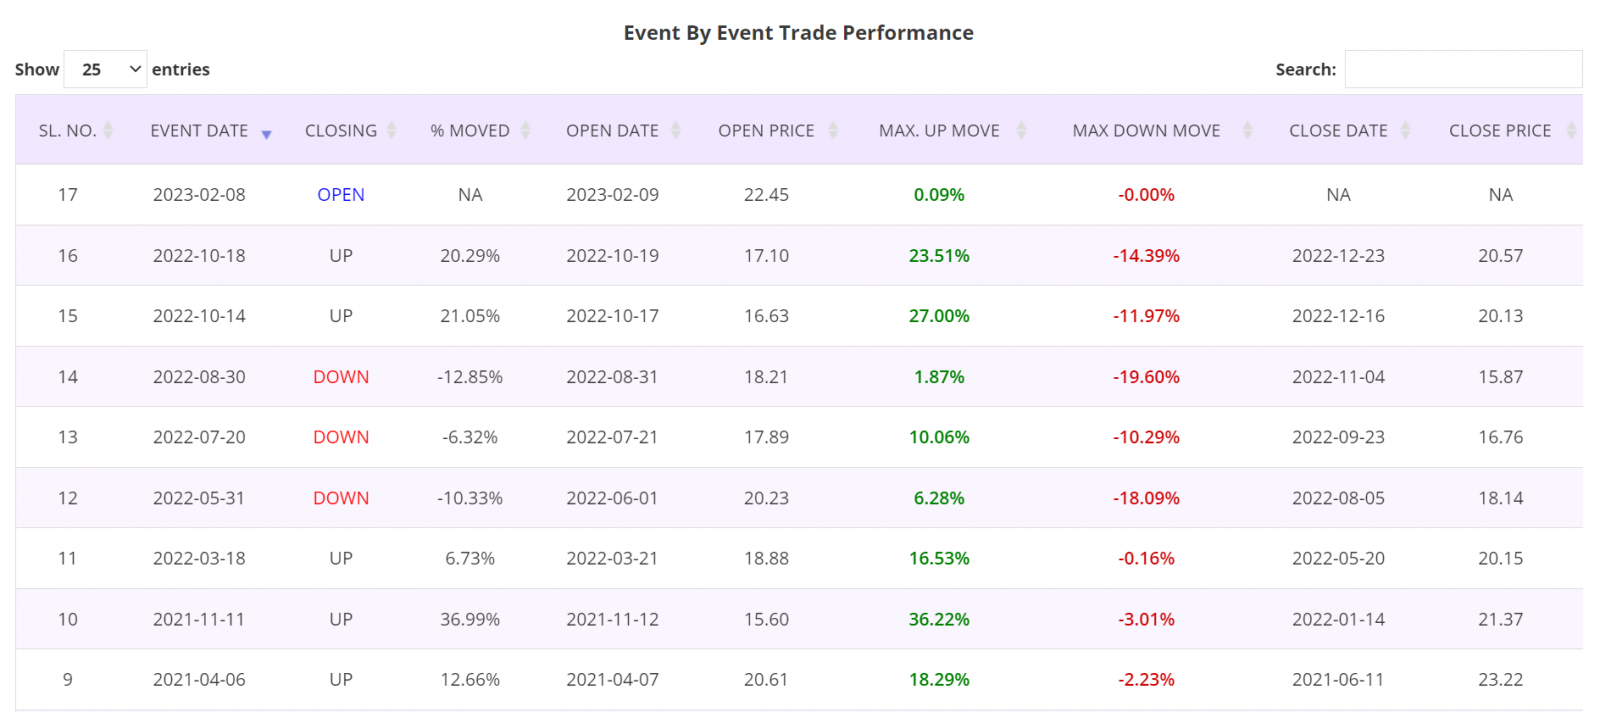
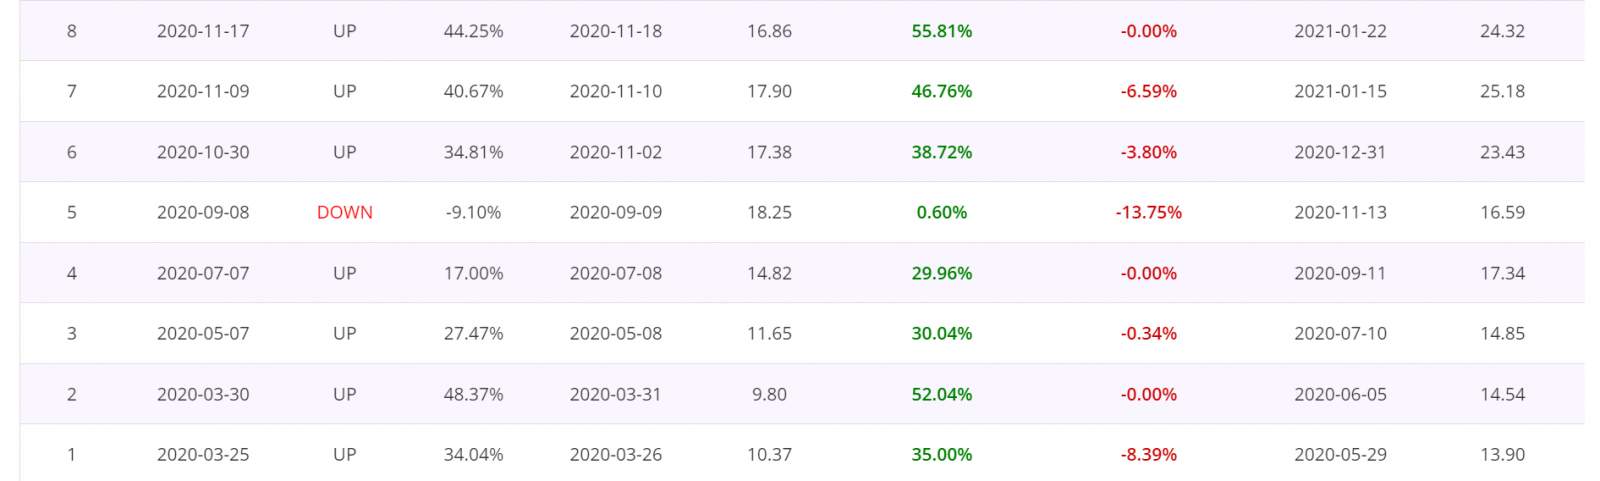
Detailed Report, Trade by Trade Performance: Results of each trade taken following the Price Action events since the beginning of 2020 are as shown in the table below. As can been seen in the table, 12 trades were winners and four losers. These tables are from the Detailed report of the Price Action trading app.
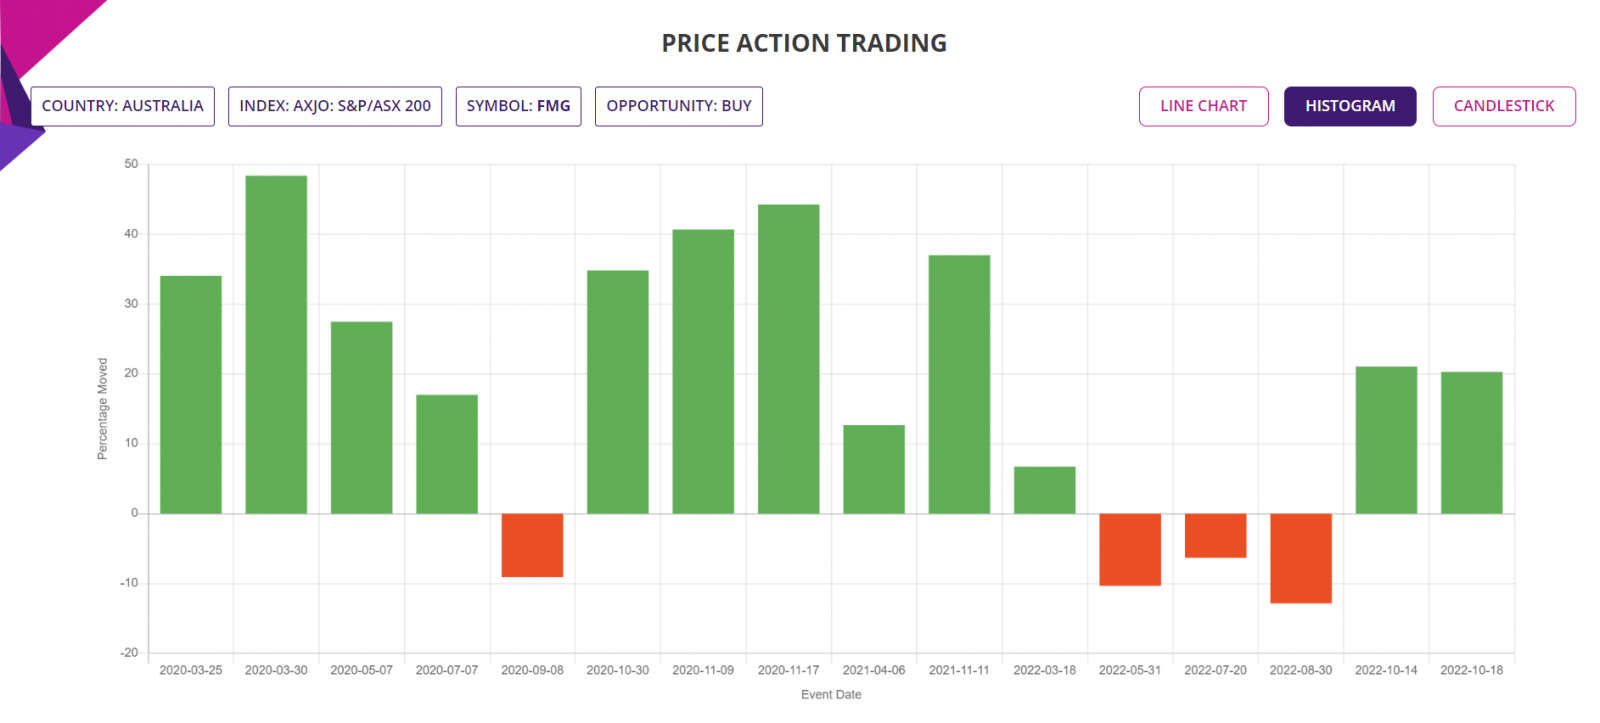
Histogram Chart: The chart below shows the percentage moves of the underlying Stock of Interest following each Price Action event for the period of analysis mentioned earlier, for a quick visual clue of the trade-by-trade performance.
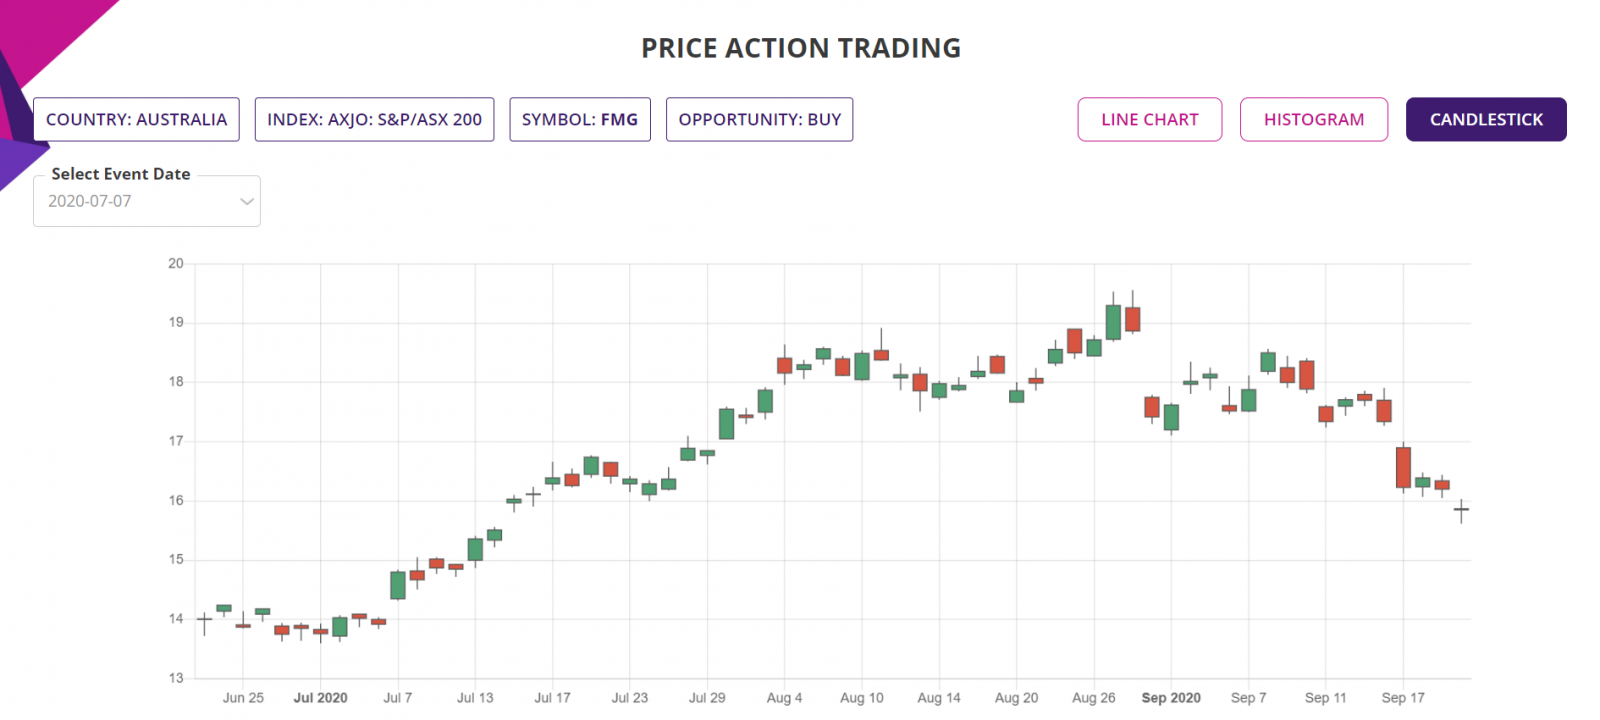
Candlestick Chart: The candlestick chart of the underlying Stock/ETF’s latest performance is as shown below. In the web-based Price Action trading app, the chart is available for all the price action events since the year in the “Data since” in the input filter page.
Trade Structure:
We would trade the Stock as CFD, structured as follows.
|
TRADE STRUCTURE (All prices in Australian Dollar or AUD) |
||
|
Stock price |
22.00 |
Assuming trade placed at last traded price |
|
Stocks |
1,000 |
Number of Stocks used for this trade |
|
Value of Stock purchase |
2,000 |
|
|
|
|
|
|
CFD leverage |
10% |
|
|
Investment required |
2,200 |
Amount of fund required for the CFD trade |
|
|
|
|
|
Target Stock price (TP) |
25.30 |
10% above the current price |
|
Stop Stock price (SL) |
20.90 |
5% below the current price |
|
|
|
|
|
Profit Target |
3,300 |
Limit order placed at underlying TP price |
|
Stop Loss |
1,100 |
Guaranteed stop at SL price |
|
Potential RoI |
150% |
Excluding commissions & CFD interest |
All P&L in the table above are exclusive of commissions or CFD interest paid.
The choice of RRR of 3:1 is historically consistent with the averages of all the trades placed since 2020 using the Price Action trading strategy.
Further Information about trading applications:
Please visit the following URL for more information on various trading applications from Sapphire Capitals which are designed to deliver high probability trading opportunities for swing trading as well as for intraday trading:
https://www.sapphirecapitals.com/pages/swing-trading-stock-seasonality-strategy/
https://www.sapphirecapitals.com/pages/swing-trading-stock-price-action-strategy/
https://www.sapphirecapitals.com/pages/swing-trading-volume-spike-stock-trading-strategy/
https://www.sapphirecapitals.com/pages/day-trading-intraday-seasonality-trading/
Disclaimer:
Sapphire Private Assets (ABN: 34 613 892 023, trading as Sapphire Capitals) is not a broker or a financial adviser but an education and research organisation; we provide training and tools for traders and DIY fund managers for trading in global financial markets. The contents of the blog have been produced by using technical analysis and trading applications developed by Sapphire Capitals for the Stock and ETF traded worldwide. The contents of this blog are intended for education and research purposes only and is not a recommendation or solicitation to invest in any Stock or ETF.
For more details, please visit www.sapphirecapitals.com/Disclaimer.


