
-
 Admin123 :
Admin - Sapphire Capitals
Admin123 :
Admin - Sapphire Capitals -
 Date :
2023-02-05
Date :
2023-02-05
Stock In Focus - Week 6 (2023) – USA – VOLUME SPIKE TRADING STRATEGY
The week beginning Monday, the 6th February is Week 6 as per ISO numbering convention of the weeks of a year.
Country in focus:
This week we look at the Stocks from USA in S&P 500 index.
Stock/ETF in focus:
Specific Stock in focus is Hasbro, Inc. (Ticker: HAS). Currency in USD. The Stock is listed in Nasdaq, the trading currency is United States Dollars or USD.
Trade Direction:
BULLISH, Volume Spike study since beginning of 2020 reveal 75% probability of success in a BUY (LONG) trade. Please note that probability is not certainty, so always trade with complete discipline of risk management and that there is a plan if trade does not playout as anticipated.
Most Recent Event:
Most recent Volume spike event was on Tuesday, the 31st January. Usually, the trade is opened on the day after the Volume Spike event, or Wednesday, the 1st February. But, since this blog is being written over the weekend, the potential trade opening is the next market open day on Monday, the 6th February.
Overview:
Hasbro, Inc., together with its subsidiaries, operates as a play and entertainment company. Hasbro, Inc. was founded in 1923 and is headquartered in Pawtucket, Rhode Island.
Its Consumer Products segment engages in the sourcing, marketing, and sale of toy and game products. This segment also promotes its brands through the out-licensing of trademarks, characters, and other brand and intellectual property rights to third parties through the sale of branded consumer products, such as toys and apparels. Its toys and games include action figures, arts and crafts and creative play products, fashion and other dolls, play sets, preschool toys, plush products, sports action blasters and accessories, vehicles and toy-related specialty products, games, and other consumer products; and licensed products, such as apparels, publishing products, home goods and electronics, and toy products. The company's Wizards of the Coast and Digital Gaming segment engages in the promotion of its brands through the development of trading card, role-playing, and digital game experiences based on Hasbro and Wizards of the Coast games. Its Entertainment segment engages in the development, acquisition, production, distribution, and sale of world-class entertainment content, including film, scripted and unscripted television, family programming, digital content, and live entertainment. The company sells its products to retailers, distributors, wholesalers, discount stores, drug stores, mail order houses, catalogue stores, department stores, and other traditional retailers, as well as ecommerce retailers; and directly to customer through Hasbro PULSE e-commerce website.
(Courtesy: Yahoo Finance)
Sector and Industry Details:
Sector(s): Consumer Cyclical
Industry: Leisure
Full Time Employees: 6,640
(Courtesy: Yahoo Finance)
Fundamentals:
52 Week Range 54.65 - 105.13
Avg. Volume 1,891,504
Market Cap 8.736B
Beta (5Y Monthly) 0.74
PE Ratio (TTM) 21.21
EPS (TTM) 2.91
Earnings Date Feb 16, 2023
Ex-Dividend Date Jan 31, 2023
(Courtesy: Yahoo Finance)
Current trading price:
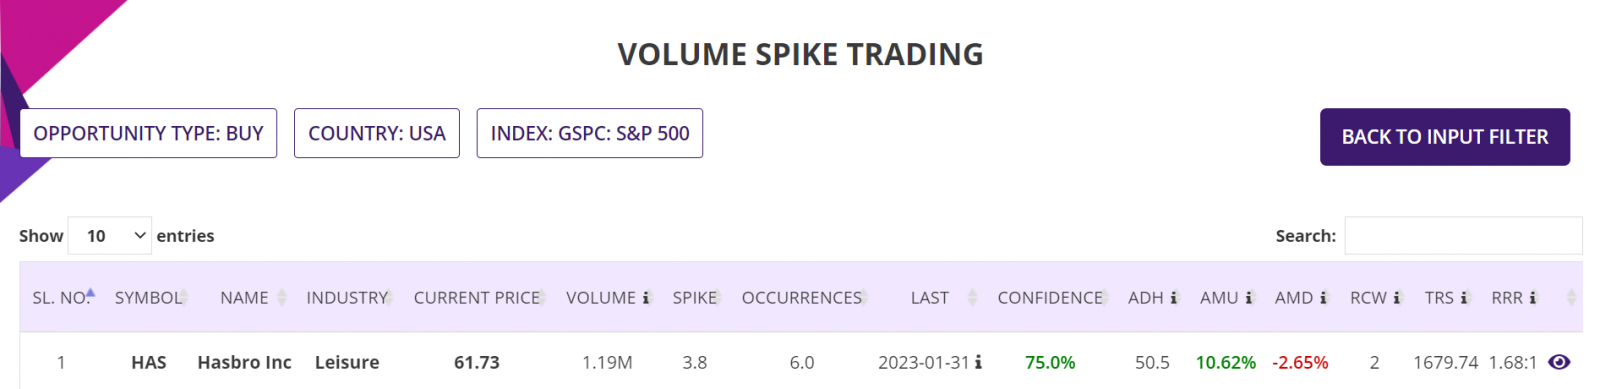
As of Tuesday, the 31st January 2023, or the day the latest Volume Spike event took place, the stock closed at 59.17. The size of the Volume Spike was 4.01X of the average volume. Also, there was another Volume Spike four days before or 27th January with a spike size of 4.09X. This is significant and indicative of buying frenzy in the market.
The last closing price on Friday, the 3rd February was 61.73, which is a 3.91% BULLISH move from the day the Volume Spike event occurred.
VOLUME SPIKE EVENT:
The Stock was BULLISH 75% of the time following Volume Spike events since the beginning of 2020, average spike size being minimum of 3X. Here is the key Volume Spike event performance of the Stock:
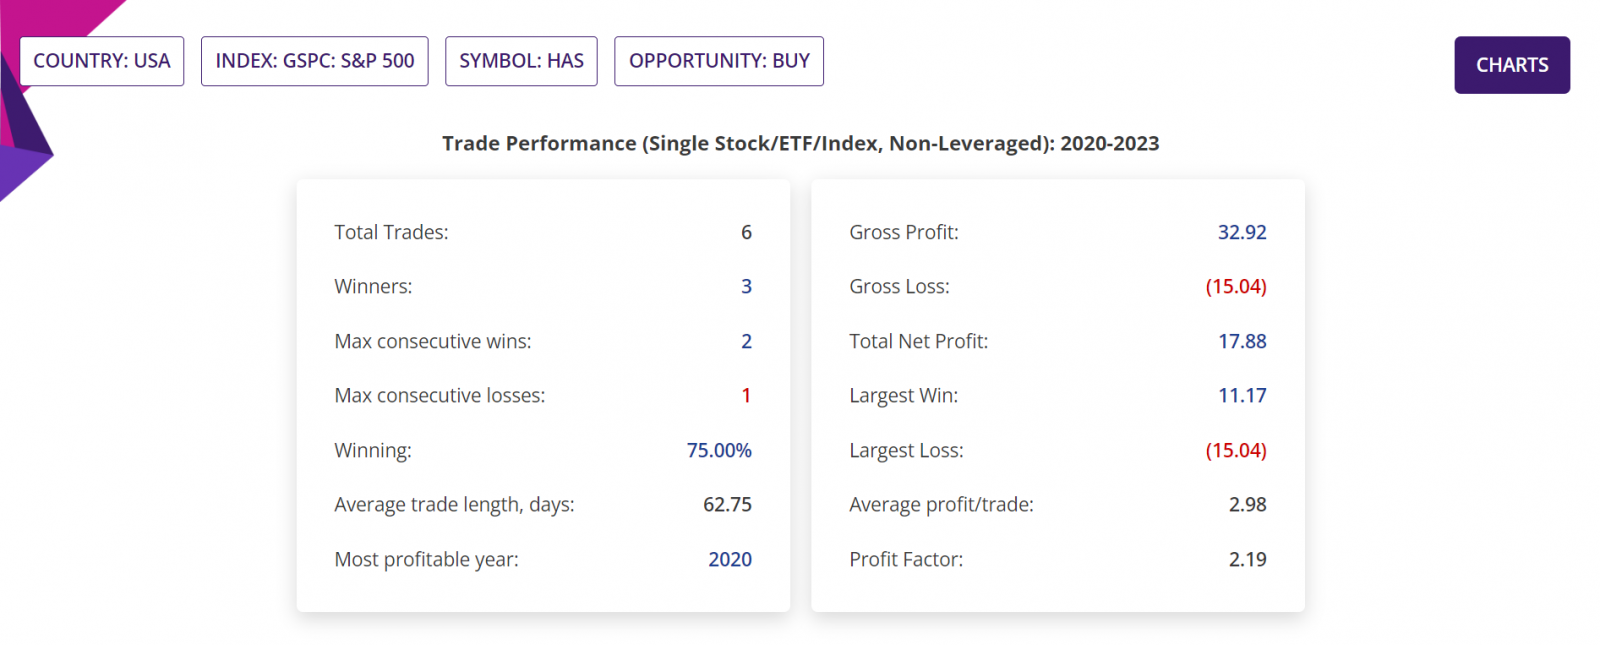
Summary report: Since beginning of 2020, there were 6 Volume Spike events, out of which one trade following the Volume Spike on 27th January is still open and the latest event of 31st January is yet to be traded, that is the current BULLISH trading opportunity being discussed in this blogpost. These leaves 4 completed trades using Volume Spike trading strategy, of which three were winners (and hence 75% confidence or Probability) with average move up (AMU) of 10.62% and average move down (AMD) of 2.65% for an average holding time (ADH) of about 51 days.
Historical RRR in those completed trades was 1.68:1. Please note that RRR shown here is a worst-case scenario, as many trades could be closed sooner with higher profit compared to trades closed at the end of 9-week period.
Detailed Report, Trade Performance: If 1,000 stocks were bought following those Volume Spike events, then a trader would have had a Gross Profit of $32,920, Gross Loss of $15,040, making a Total Net Profit of $17,880. In those closed trades, the Largest Win was $11,170, the Largest Loss is $15,040, the Average profit/trade being $2,980. All figures above are in USD.
The Profit Factor (which is quotient of Gross Profit and Gross Loss) in those trades was 2.19.
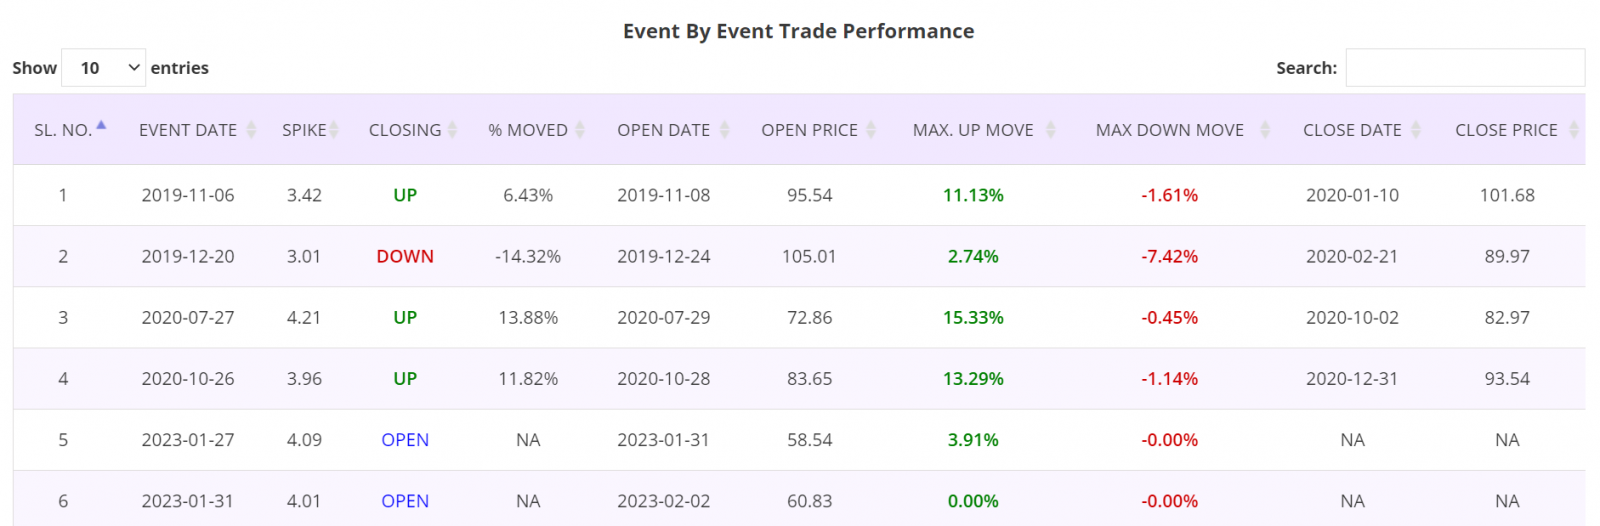
Detailed Report, Trade by Trade Performance: Results of each trade taken following the Volume Spike events since the beginning of 2020 are as shown in the table below. As can been seen in the table, 3 out of 4 trades were winners. These tables are from the Detailed report of the Volume Spike trading app.
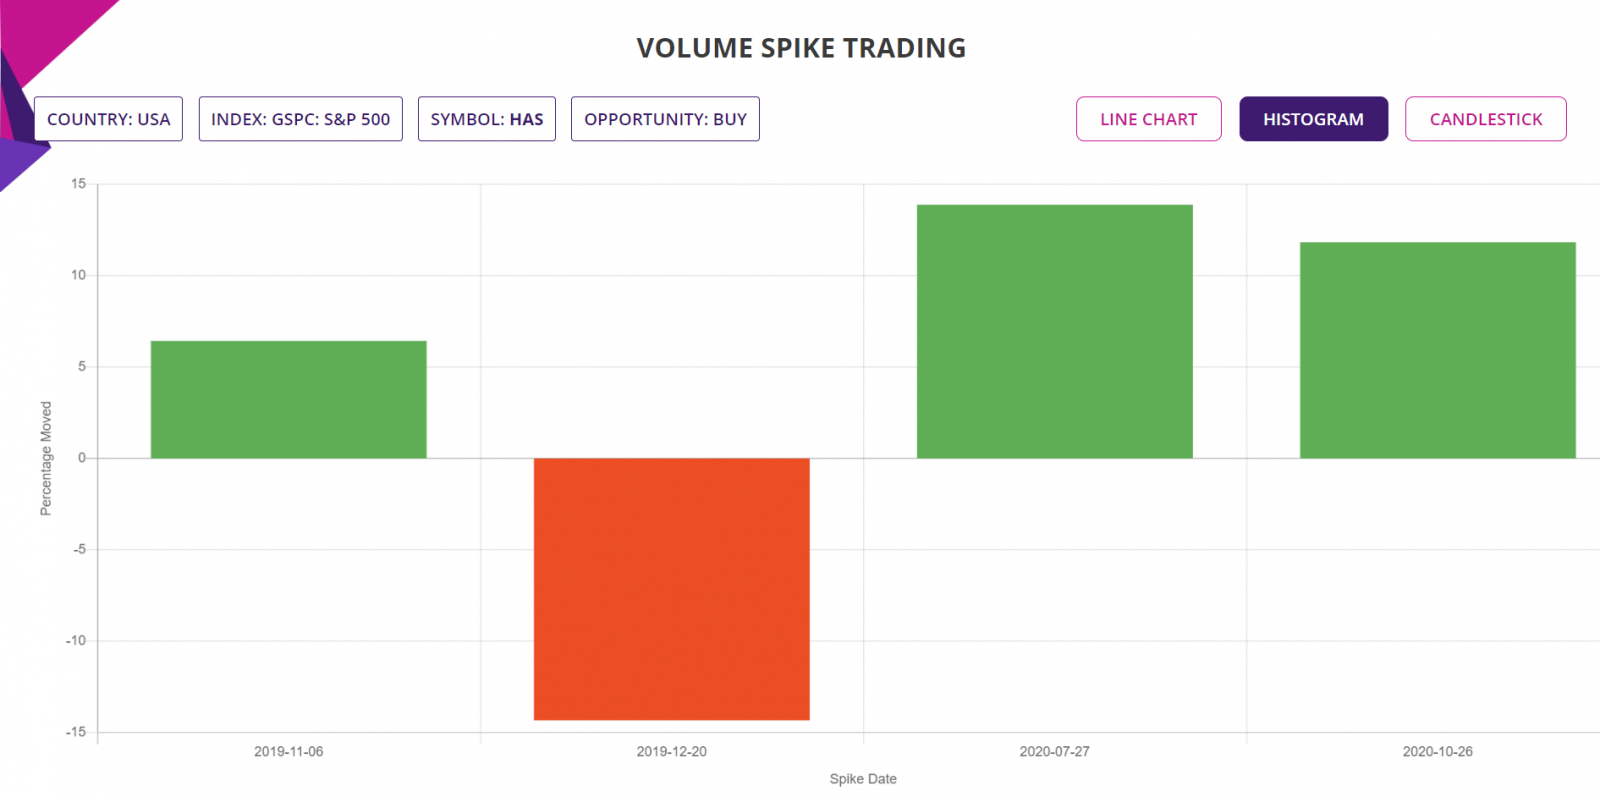
Histogram Chart: The chart below shows the percentage moves of the underlying Stock of Interest following each Volume Spike event for the period of analysis mentioned earlier, for a quick visual clue of the trade-by-trade performance.
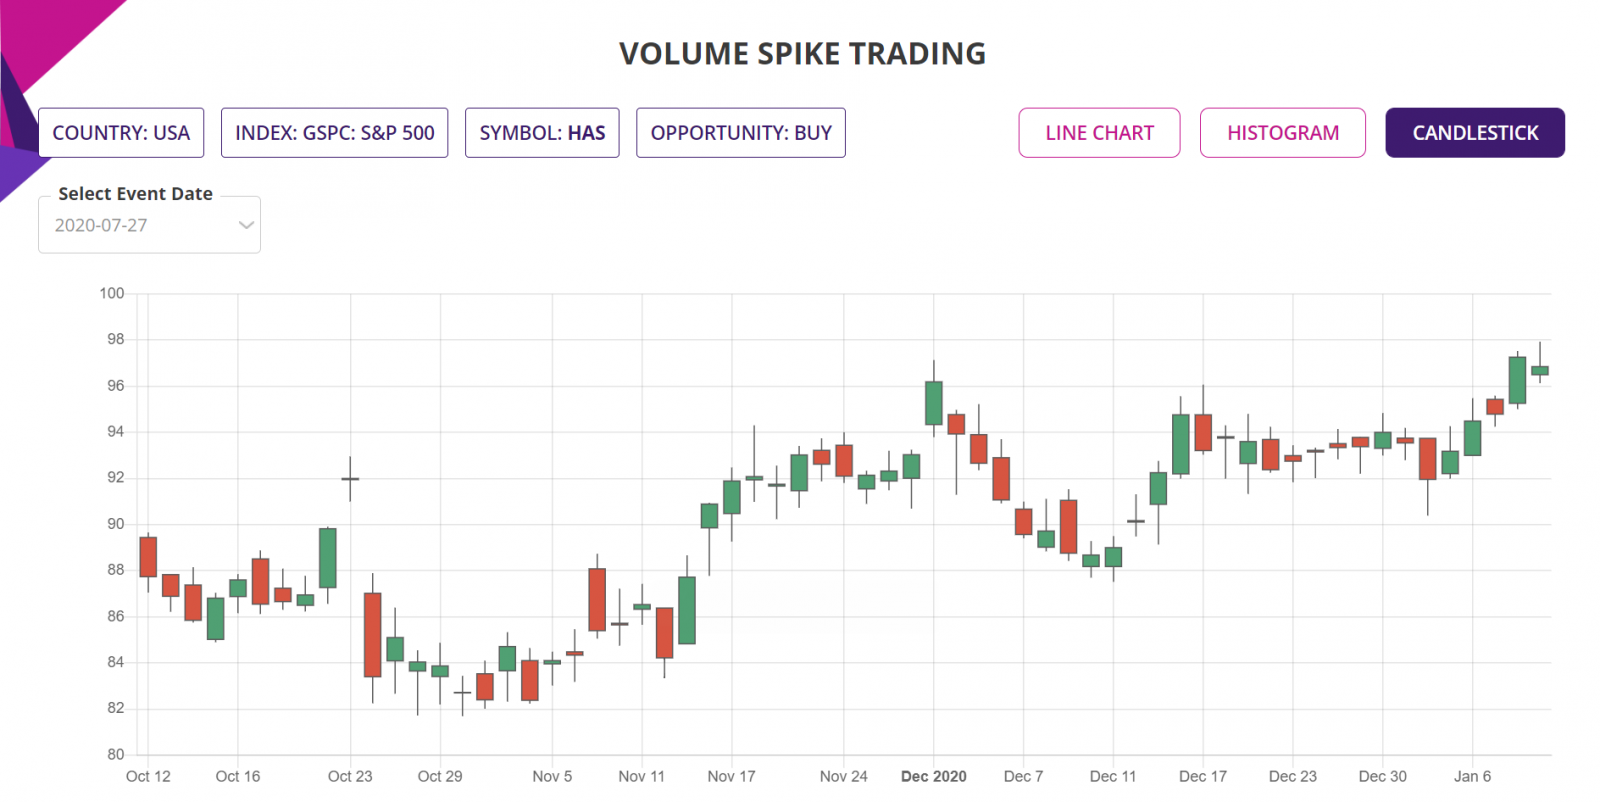
Candlestick Chart: The candlestick chart of the underlying Stock/ETF’s latest performance is as shown below. In the web-based Volume Spike trading app, the chart is available for all the Volume Spike events since the year in the “Data since” in the input filter page.
Trade Structure:
We would trade the Stock as CFD trade, structured as follows.
|
TRADE STRUCTURE (All prices in US Dollars or USD) |
||
|
Stock price |
$61.73 |
USD |
|
CFDs |
1,000 |
Number of Stocks used for this CFD trade |
|
CFD Margin |
10% |
CFD leverage |
|
|
|
|
|
Margin |
$6,173.00 |
Amount of fund required for the trade |
|
|
|
|
|
Target Stock price |
$67.90 |
10% above the current price, limit order placed at this underlying price |
|
Stop Stock price |
$59.88 |
3% below the current price, guaranteed stop at this price |
|
|
|
|
|
Profit Target |
$6,173.00 |
This is RoI of 100%, less trading commissions and CFD interest paid |
|
Stop Loss |
$1,851.90 |
|
|
RRR |
3 |
|
All P&L in the table above are exclusive of commissions or CFD interest paid.
The choice of RRR of 3:1 is historically consistent with the averages of the 4 trades placed since 2020 using the Volume Spike strategy.
Further Information about trading applications:
Please visit the following URL for more information on various trading applications from Sapphire Capitals which are designed to deliver high probability trading opportunities for swing trading as well as for intraday trading:
https://www.sapphirecapitals.com/pages/swing-trading-stock-seasonality-strategy/
https://www.sapphirecapitals.com/pages/swing-trading-stock-price-action-strategy/
https://www.sapphirecapitals.com/pages/swing-trading-volume-spike-stock-trading-strategy/
https://www.sapphirecapitals.com/pages/day-trading-intraday-seasonality-trading/
Disclaimer:
Sapphire Private Assets (ABN: 34 613 892 023, trading as Sapphire Capitals) is not a broker or a financial adviser but an education and research organisation; we provide training and tools for traders and DIY fund managers for trading in global financial markets. The contents of the blog have been produced by using technical analysis and trading applications developed by Sapphire Capitals for the Stock and ETF traded worldwide. The contents of this blog are intended for education and research purposes only and is not a recommendation or solicitation to invest in any Stock or ETF.
For more details, please visit http://www.sapphirecapitals.com/Disclaimer.


