
-
 Admin123 :
Admin - Sapphire Capitals
Admin123 :
Admin - Sapphire Capitals -
 Date :
2023-01-29
Date :
2023-01-29
Stock In Focus - Week 5 (2023) – FRANCE – SEASONALITY TRADING STRATEGY
At the writing of the blog, the final of the first tennis grand slam of the year is being played in Melbourne, Australia. May the better player lift the coveted trophy.
The week beginning Monday, the 30th January is Week 5 as per ISO numbering convention of the weeks of a year.
Country in focus:
This week we look at the Stocks from FRANCE in CAC40 index, which is a capitalization-weighted measure of the 40 most significant stocks in the Euronext Paris (formerly the Paris Bourse).
Stock/ETF in focus:
Specific Stock in focus Thales S.A. (Ticker: HO). The Stock is listed in the Euronext Paris stock exchange, trading currency being Euro or EUR.
Trade Direction:
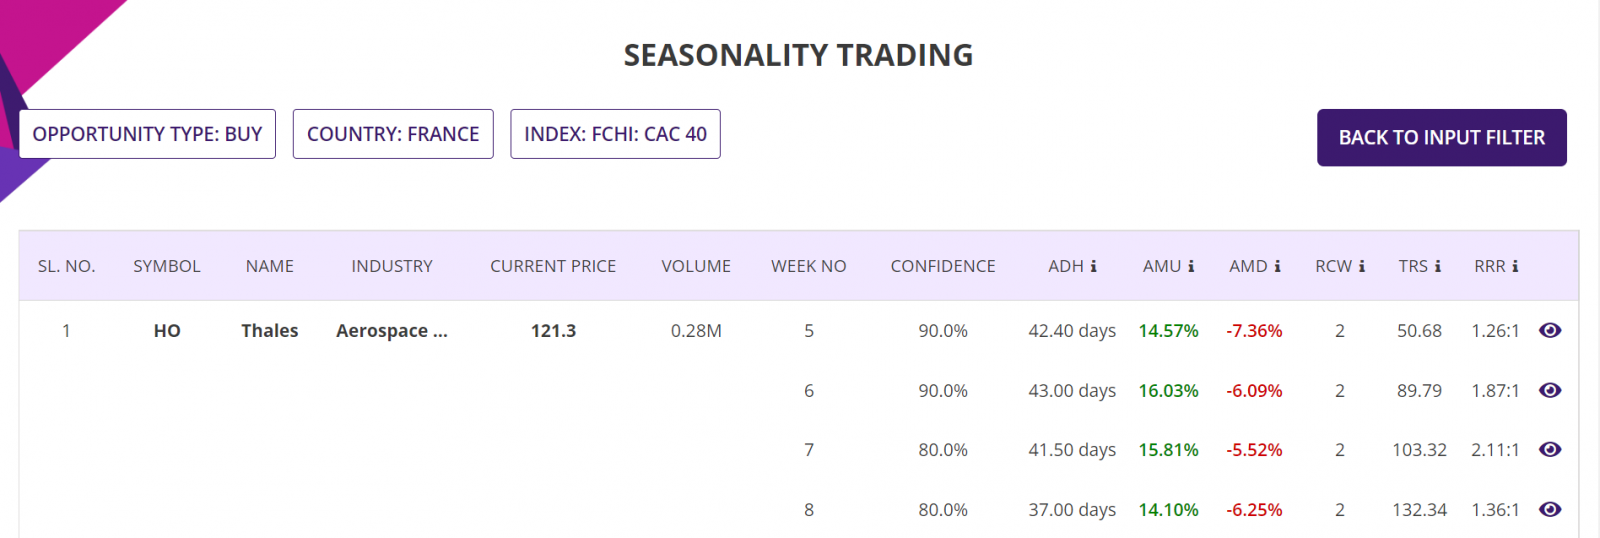
BULLISH, Seasonality study for last 10 years since 2013 reveal 90.0% probability of success in a BUY (LONG) trade for this week and 90% probability for the trade next week (Week 5) and 80% probability in the week after (Week 6). Please see the Summary report screenshot later in the blog.
What is Seasonality trading strategy? please watch this short video to understand what is it and how you can put Probability on your side with Stock market Seasonality. Probability and Risk-Reward Ratio (RRR) are the two best friends of a trader.
Overview:
Thales S.A. provides various solutions for civilian and military customers in the aeronautics, space, defense, security, ground transportation, and digital security markets worldwide. The company was formerly known as Thomson-CSF and changed its name to Thales S.A. in 2000. Thales S.A. was founded in 1893 and is headquartered in Courbevoie, France.
The company operates through Aerospace, Transport, Defence & Security, and Digital Identity & Security segments. The company offers communications, command, and control systems; mission services and support; protection and mission/combat systems; surveillance, detection, and intelligence systems; training and simulation solutions for air, land, naval, and joint forces; and digital identity and security solutions. It also provides air traffic management solutions; flight decks and avionics equipment and functions; in-flight entertainment and connectivity systems and services; electrical systems; aerospace training solutions; navigation solutions; support and services for avionics equipment; and vision systems. In addition, the company designs, operates, and delivers satellite-based systems for telecommunications, navigation, earth observation, environmental management, exploration, and science and orbital infrastructures; signalling, communications and supervision, and fare collection management systems and related services; cybersecurity and railway digitalization systems; and main line rail, and urban and intermodal mobility solutions. Further, it provides solutions for various markets and applications, including radiology, radio frequency, microwave sources, training and simulation solutions, lasers, and microelectronics solutions for science, industry, space, defense, automotive, railways, and energy conversion platforms. Thales S.A. has a strategic agreement with Google LLC.
(Courtesy: Yahoo Finance)
Sector and Industry Details:
Sector(s): Industrials
Industry: Aerospace & Défense
Full Time Employees: 76,135
(Courtesy: Yahoo Finance)
Fundamentals:
52 Week Range 77.56 - 131.15
Avg. Volume 315,900
Market Cap 26.094B
Beta (5Y Monthly) 0.64
PE Ratio (TTM) 22.89
EPS (TTM) 5.30
Earnings Date Mar 08, 2023
Ex-Dividend Date Dec 06, 2022
1y Target Est 141.10
(Courtesy: Yahoo Finance)
Current trading price:
As of Friday, close of 27th January 2023, the stock was trading at 121.30. All prices are in Euro or EUR.
SEASONALITY:
The stock demonstrated very strong Seasonal move in week 5 of the year, here are some of the details of its Seasonal behaviour.
Summary report: In 9 out of last 10 years in week 5, the stock was BULLISH with average move up (AMU) of 14.57% and average move down (AMD) of 7.36% for an average holding time (ADH) of about 42 days. The worst-case average Reward-Risk Ratio (RRR) for all 10 trades over last 10 years was 1.26:1. See the summary report table below:
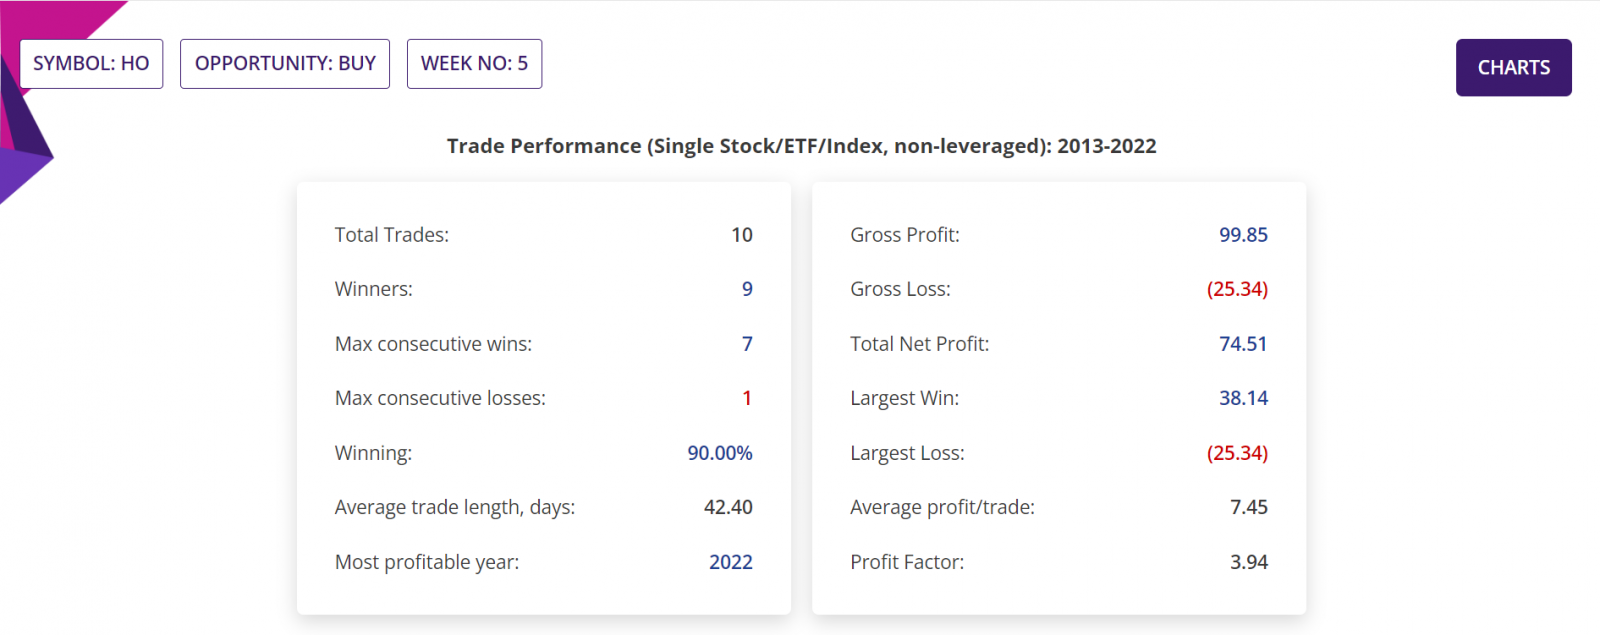
Detailed Report, Trade Performance: If 1,000 stocks were bought in the beginning of week 5 every year for last 10 years, then a trader would have had a Gross Profit of EUR99,850, Gross Loss of EUR25,340, making a Total Net Profit of EUR74,510.
In those 10 years, the Largest Win was EUR38,140 (in the year 2022), Largest Loss is EUR25,340 (in the year 2020), which is the only loss in last 10 years and the Average profit/trade being EUR7,450. Profit factor (quotient of Gross Profit and Gross Loss) being 3.94. All figures excluding trading commissions. Please see the section of the detailed report below.
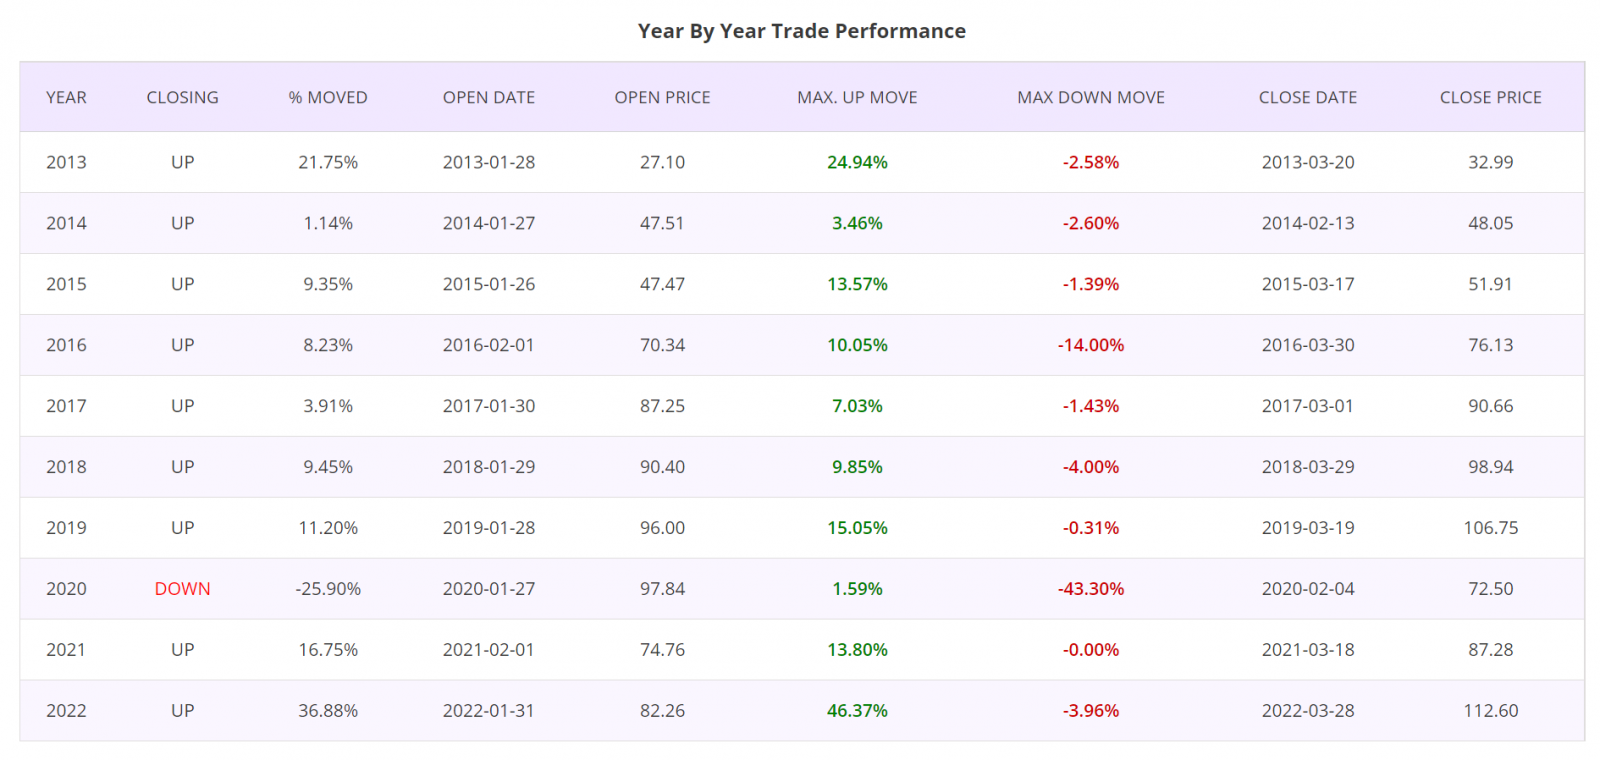
Detailed Report, Year by Year Trade Performance: Trades taken at the beginning of Week 5 for all years of last 10 years was winners, except for the year 2020, the year which is marked by meltdown of stock markets around the world with average drop of stock prices in excess of 30%. Prior to year 2020 and since that year, the Stock was always a winner in Week 5 of the year. Please see the section of the detailed report below.
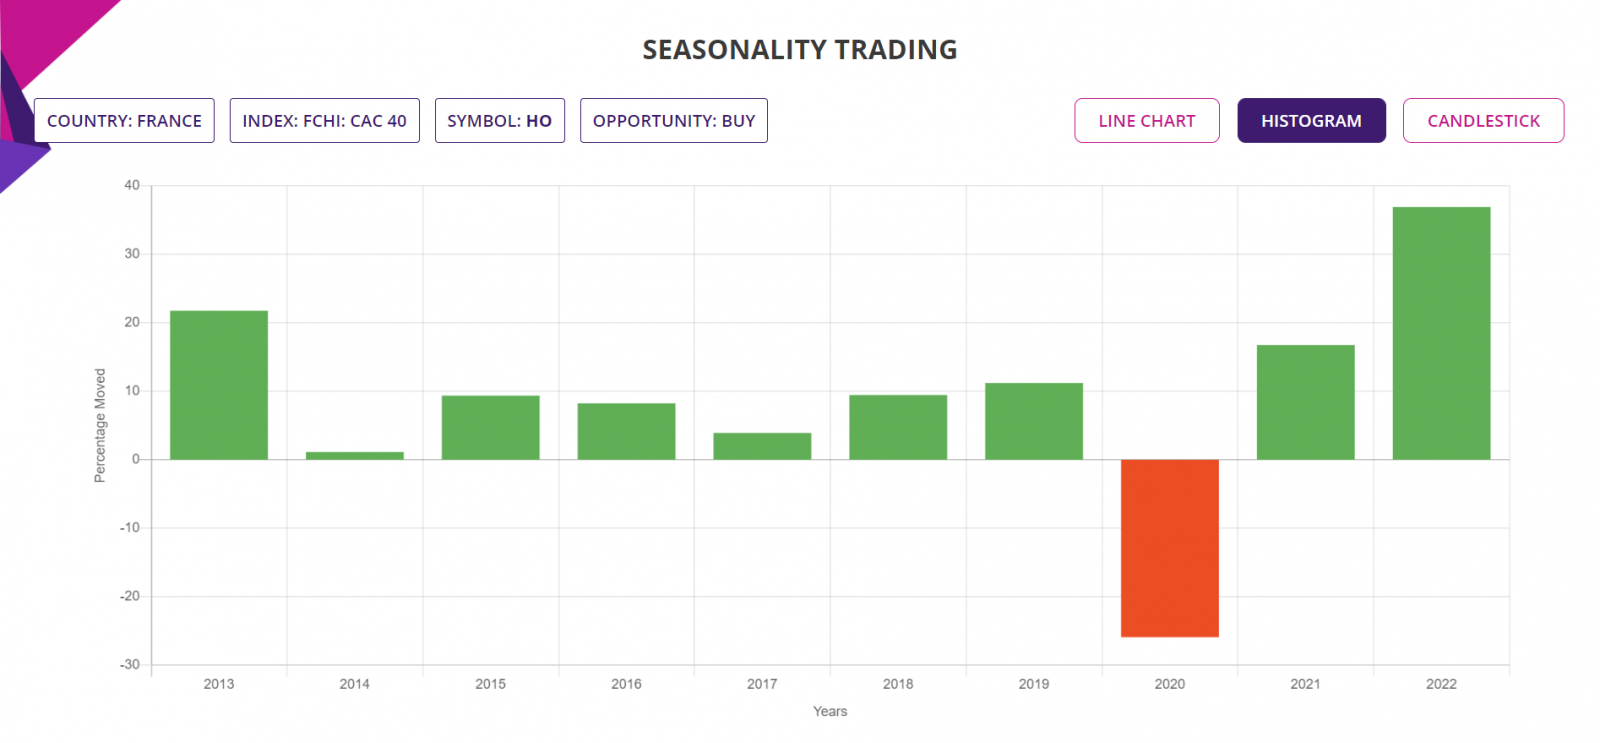
Histogram Chart: The chart below shows the percentage moves of the underlying Stock of Interest in each of the years in the Seasonality analysis, for a quick visual clue of the year-by-year trade performance.
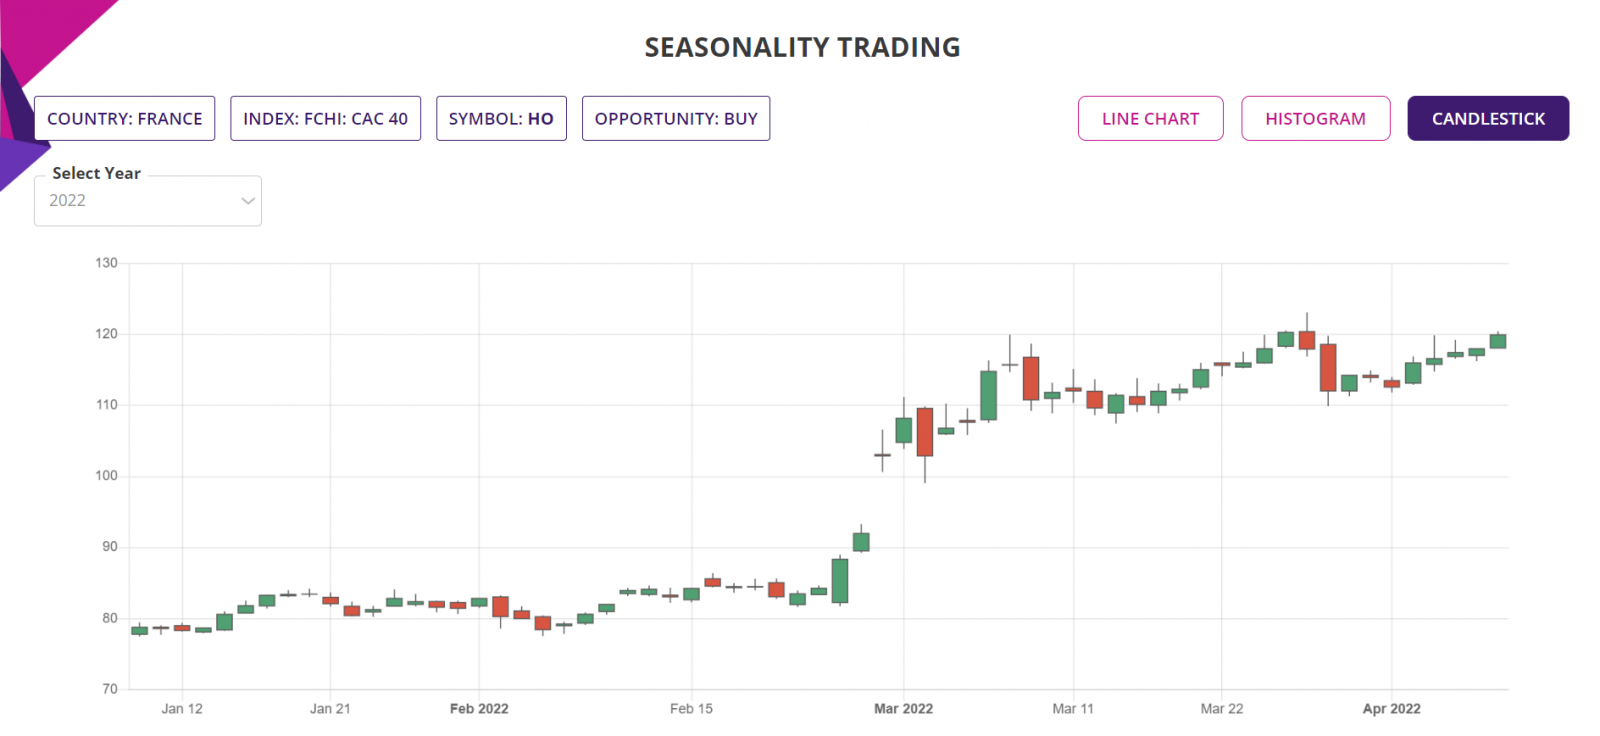
Candlestick Chart: The candlestick chart of the underlying Stock/ETF’s latest performance is as shown below. In the web-based Seasonality trading application, the chart is available for all the years of the Seasonality analysis.
Trade Structure:
If we had traded the Stock this week, then we would have structured the trade as follows:
|
TRADE STRUCTURE (All prices in Euro) |
||
|
Stock price |
€ 121.30 |
Euro |
|
CFDs |
1,000 |
Number of Stocks used for this CFD trde |
|
Leverage |
10 |
CFD leverage |
|
|
|
|
|
Margin required |
€ 12,130.00 |
Amount of fund required for the trade |
|
|
|
|
|
Target Stock price (TP) |
€ 133.43 |
10% above the current price |
|
Stop Stock price (SL) |
€ 115.24 |
5% below the current price |
|
|
|
|
|
Profit Target |
€ 12,130.00 |
Limit order placed at underlying price of TP |
|
Stop Loss |
€ 6,065.00 |
Guaranteed stop at SL price |
|
Return on Investment (RoI) |
100% |
|
The choice of RRR of 2:1 is in line with the expected RRR from the last 10 trades in each of the last 10 years in Week 3, since 2013 till 2022.
The extraordinary high RoI is achieved by trading the Stock as CFD where the broker allows a leverage of 10:1. So there will be interest payable on CFD funding, usually at the rate of 90 days bank bill rate PLUS 2%, calculated daily for the duration the trade is held. The above table is a simplistic view of the trade profitability without considering the CFD interest and trading commissions or any other costs.
Further Information about trading applications:
Please visit the following URL for more information on various trading applications from Sapphire Capitals which are designed to deliver high probability trading opportunities for swing trading as well as for intraday trading:
https://www.sapphirecapitals.com/pages/swing-trading-stock-seasonality-strategy/
https://www.sapphirecapitals.com/pages/swing-trading-stock-price-action-strategy/
https://www.sapphirecapitals.com/pages/swing-trading-volume-spike-stock-trading-strategy/
https://www.sapphirecapitals.com/pages/day-trading-intraday-seasonality-trading/
Disclaimer:
Sapphire Private Assets (ABN: 34 613 892 023, trading as Sapphire Capitals) is not a broker or a financial adviser but an education and research organisation; we provide training and tools for traders and DIY fund managers for trading in global financial markets. The contents of the blog have been produced by using technical analysis and trading applications developed by Sapphire Capitals for the Stock and ETF traded worldwide. The contents of this blog are intended for education and research purposes only and is not a recommendation or solicitation to invest in any Stock or ETF.
For more details, please visit www.sapphirecapitals.com/Disclaimer.


