
-
 Admin123 :
Admin - Sapphire Capitals
Admin123 :
Admin - Sapphire Capitals -
 Date :
2023-01-22
Date :
2023-01-22
Stock of interest - Week 4 (2023) - AUSTRALIA – PRICE ACTION TRADING STRATEGY
The week beginning Monday, the 23rd January is Week 4 as per ISO numbering convention of the weeks of a year.
Country in focus:
This week we look at the Stocks from Australia in S&P/ASX 200 index.
Stock/ETF in focus:
Specific Stock in focus is Chorus Limited (Ticker: CNU). The trading currency is Australian Dollar or AUD.
Trade Direction:
BULLISH, Price Action study since 2020 reveal 72.7% probability of success with historical worst-case RRR of over 0.63:1 in all completed BUY (LONG) trade.
Please note that the RRR is well below the level at which we would like to trade. As such, this Stock is for observation only and not recommended for live trading.
Most Recent Event: Most recent Price Action event was on Wednesday, the 18th January. Preferred trade opening is the next market open day on Thursday, the 19th January or Friday, the 20th January.
Overview:
Chorus Limited, together with its subsidiaries, provides fixed line communications infrastructure services in New Zealand. Chorus Limited was founded in 2008 and is based in Wellington, New Zealand.
It offers phone and broadband services for residential and business customers; and high-speed digital subscriber line broadband services. The company builds and maintains a network of fibre and copper cables, local telephone exchanges, and cabinets. It also provides colocation services.
(Courtesy: Yahoo Finance)
Sector and Industry Details:
Sector(s): Communication Services
Industry: Telecom Services
Full Time Employees: 799
(Courtesy: Yahoo Finance)
Fundamentals:
52 Week Range 6.07 - 8.20
Avg. Volume 550,154
Market Cap 3.41B
PE Ratio (TTM) 76.40
EPS (TTM) 0.10
Ex-Dividend Date Sep 12, 2022
(Courtesy: Yahoo Finance)
Current trading price:
As of Wednesday, the 18th January 2022, or the day the Price Action event took place, the stock closed at 7.70. The last closing price on Friday, the 20th January was 7.64.
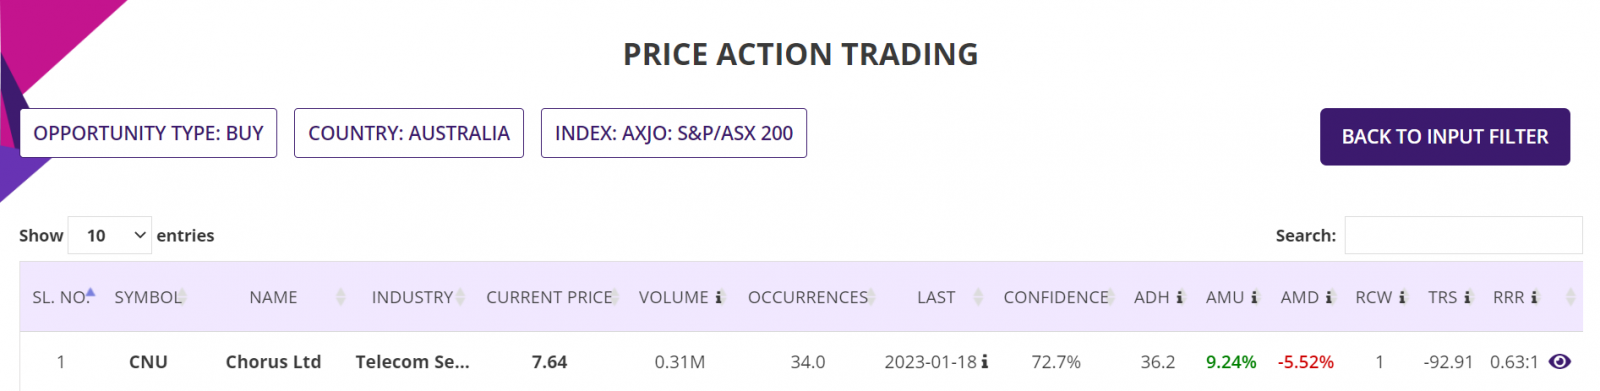
PRICE ACTION:
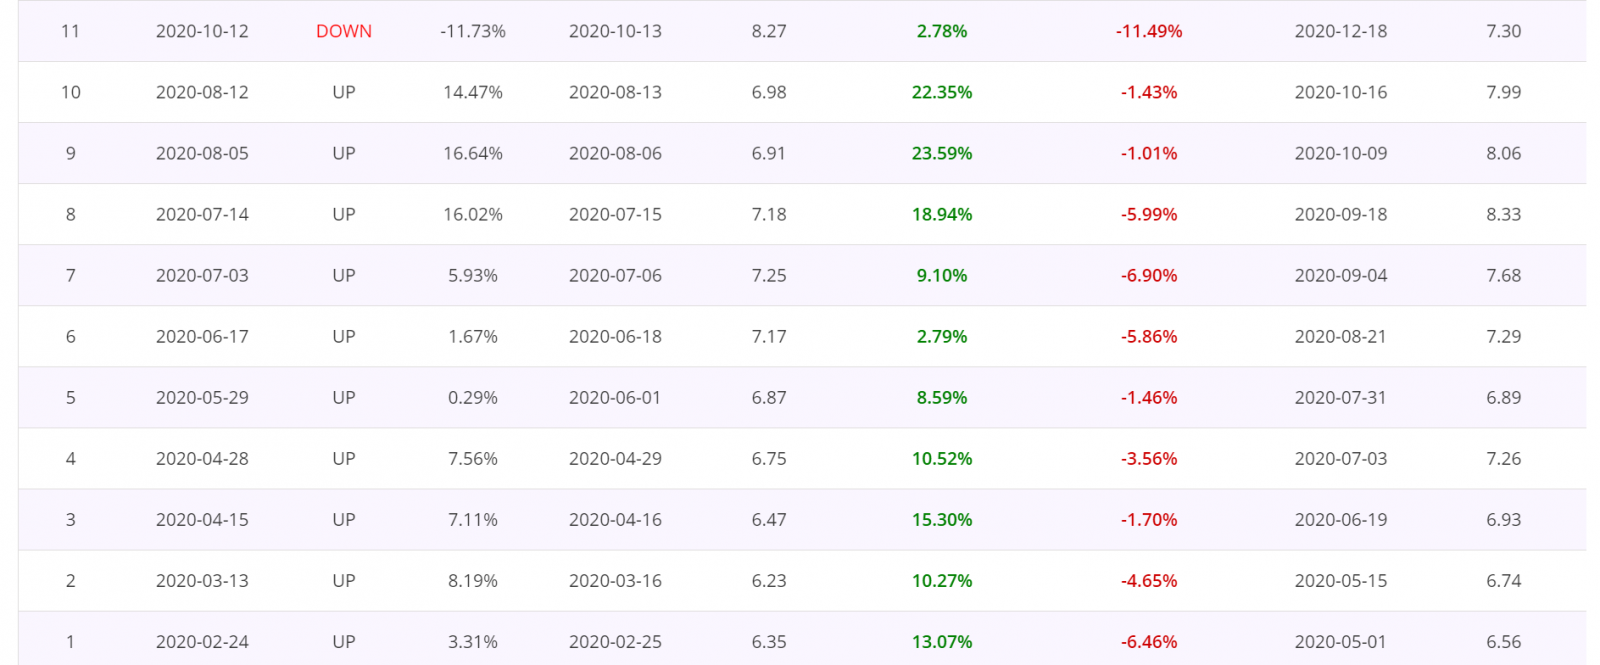
The Stock was Bullish 72.7% of the time following Bullish Price action events since the beginning of 2020. Here is the key Price Action event performance of the Stock:
Summary report: Since beginning of 2020, there were 34 BULLISH Price action events, of which one event is yet to be traded, that is the current Bullish trading opportunity being discussed in this blogpost. These leaves 33 completed trades, of which 24 were winners (and hence 72.7% confidence or Probability) with average move up (AMU) of 9.24% and average move down (AMD) of 5.52% for an average holding time (ADH) of about 36 days.
Historical RRR in those completed trades was 0.63:1. Please note that RRR shown here is a worst-case scenario, as many trades could be closed sooner with higher profit compared to trades closed at the end of 9-week period.
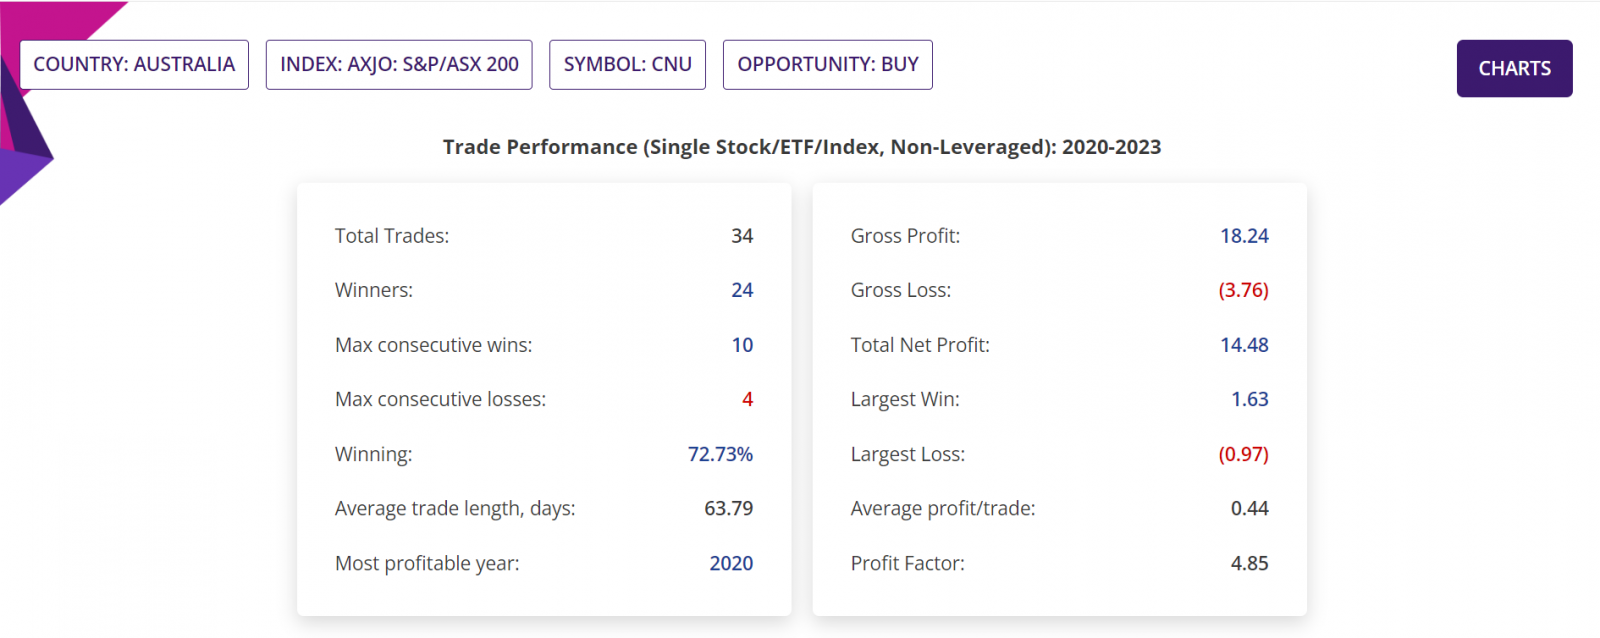
Detailed Report, Trade Performance: If 1,000 stocks were bought following those BULLISH Price action events, then a trader would have had a Gross Profit of $18,240, Gross Loss of $3,760, making a Total Net Profit of $14,480. In those closed trades, the Largest Win was $1,630, Largest Loss is $970, the Average profit/trade being $440. All figures above are in AUD.
The Profit Factor (which is quotient of Gross Profit and Gross Loss) in those trades was 4.85.
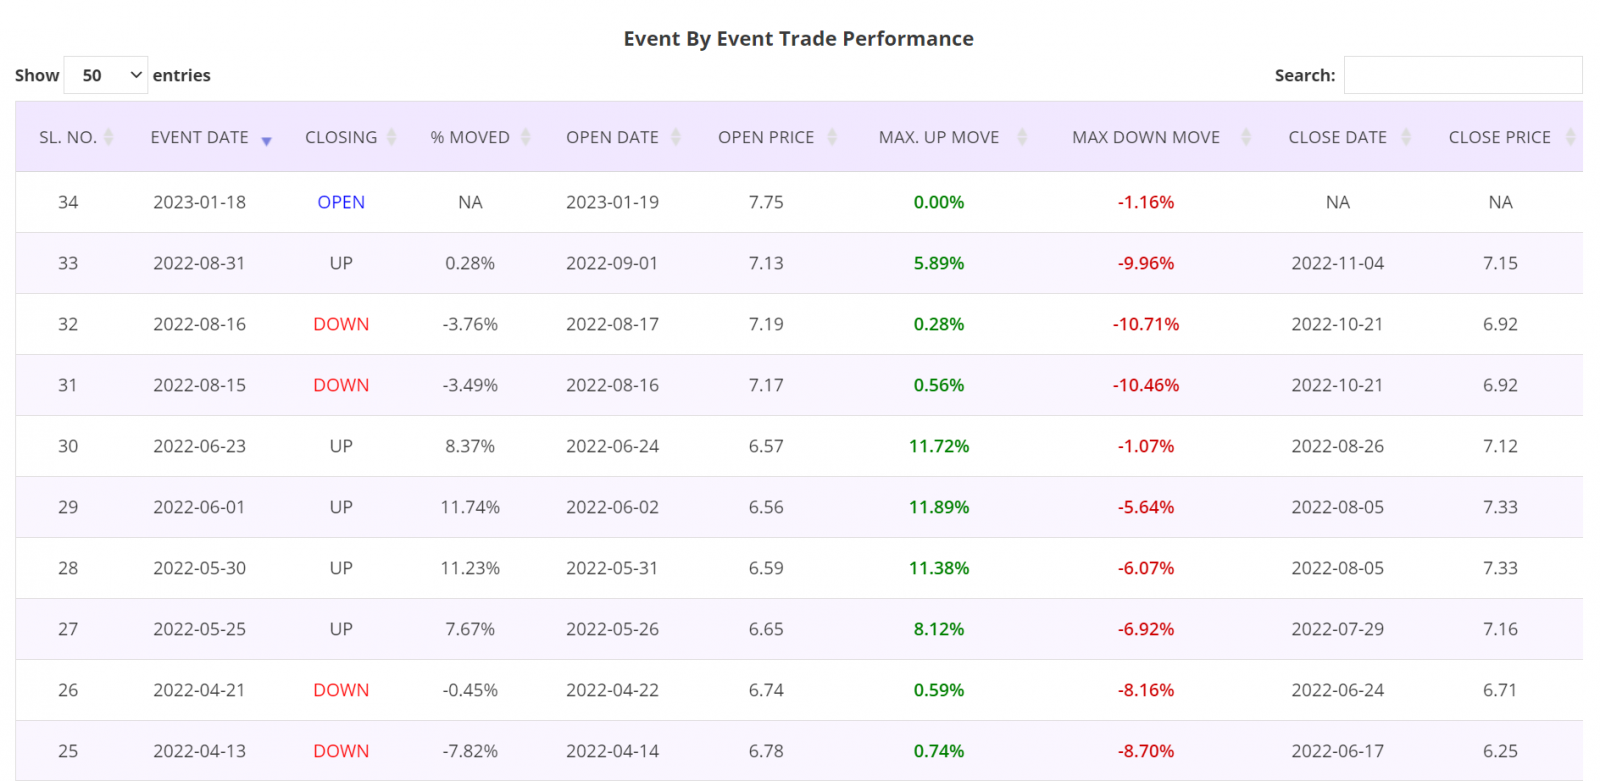
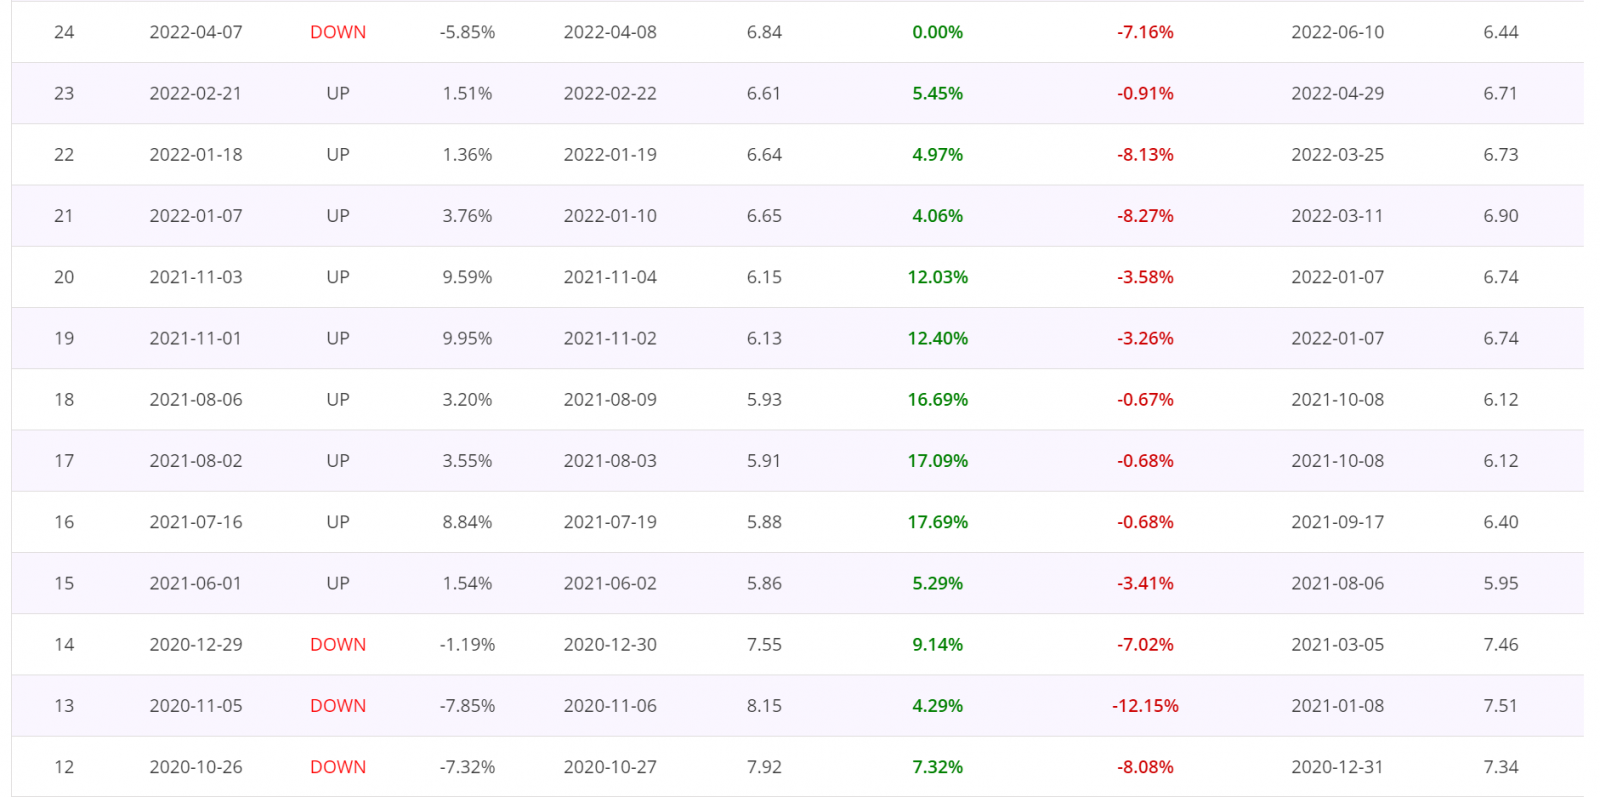
Detailed Report, Trade by Trade Performance: Results of each trade taken following the Price Action events since the beginning of 2020 are as shown in the table below. As can been seen in the table, 24 trades were winners and nine losers. These tables are from the Detailed report of the Price Action trading app.
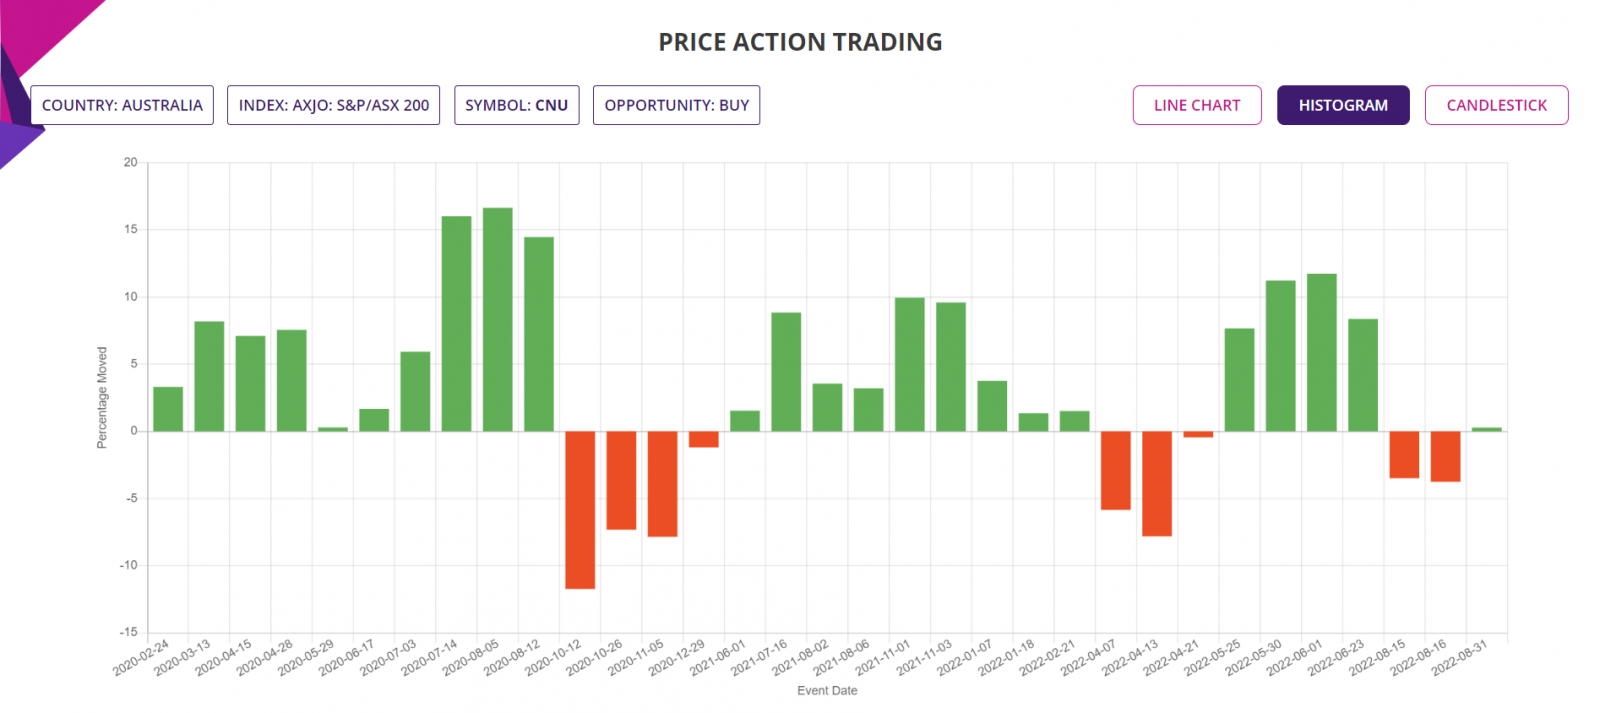
Histogram Chart: The chart below shows the percentage moves of the underlying Stock of Interest following each Price Action event for the period of analysis mentioned earlier, for a quick visual clue of the trade-by-trade performance.
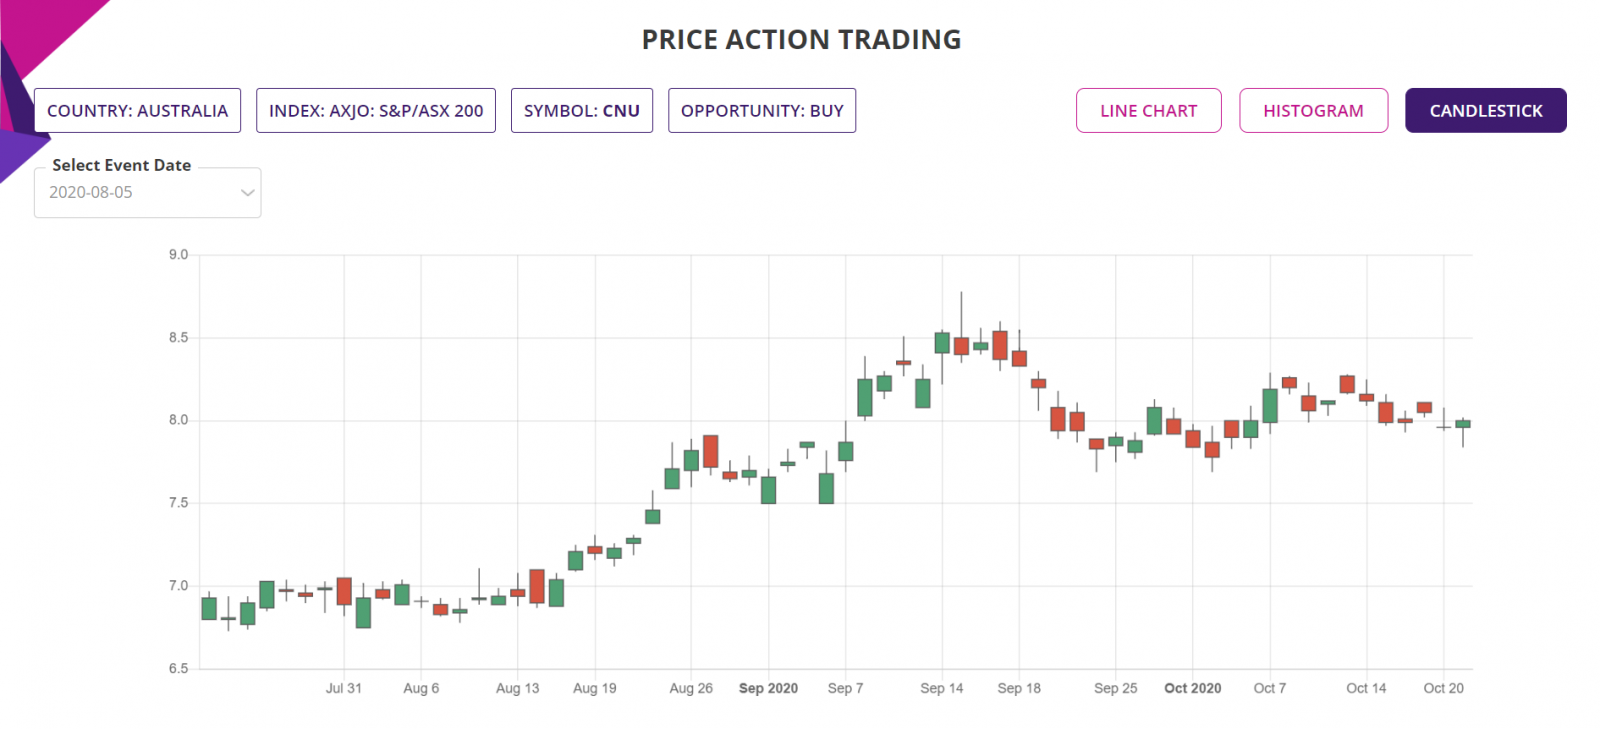
Candlestick Chart: The candlestick chart of the underlying Stock/ETF’s latest performance is as shown below. In the web-based Price Action trading app, the chart is available for all the price action events since the year in the “Data since” in the input filter page.
Trade Structure:
Since, this opportunity is a observation only, we are not providing any trade structure.
Further Information about trading applications:
Please visit the following URL for more information on various trading applications from Sapphire Capitals which are designed to deliver high probability trading opportunities for swing trading as well as for intraday trading:
https://www.sapphirecapitals.com/pages/swing-trading-stock-seasonality-strategy/
https://www.sapphirecapitals.com/pages/swing-trading-stock-price-action-strategy/
https://www.sapphirecapitals.com/pages/swing-trading-volume-spike-stock-trading-strategy/
https://www.sapphirecapitals.com/pages/day-trading-intraday-seasonality-trading/
Disclaimer:
Sapphire Private Assets (ABN: 34 613 892 023, trading as Sapphire Capitals) is not a broker or a financial adviser but an education and research organisation; we provide training and tools for traders and DIY fund managers for trading in global financial markets. The contents of the blog have been produced by using technical analysis and trading applications developed by Sapphire Capitals for the Stock and ETF traded worldwide. The contents of this blog are intended for education and research purposes only and is not a recommendation or solicitation to invest in any Stock or ETF.
For more details, please visit www.sapphirecapitals.com/Disclaimer.


