
-
 Admin123 :
Admin - Sapphire Capitals
Admin123 :
Admin - Sapphire Capitals -
 Date :
2023-01-15
Date :
2023-01-15
Stock In Focus - Week 3 (2023) – AUSTRALIA – SEASONALITY TRADING STRATEGY
The holiday season over the Christmas period of 2022 and New Year of 2023 is over, trading is back in focus and so is a new Stock or ETF. Hope you all a good festive season during the holidays and back at your trading computer with a trading plan.
The week beginning Monday, the 16th January is Week 3 as per ISO numbering convention of the weeks of a year.
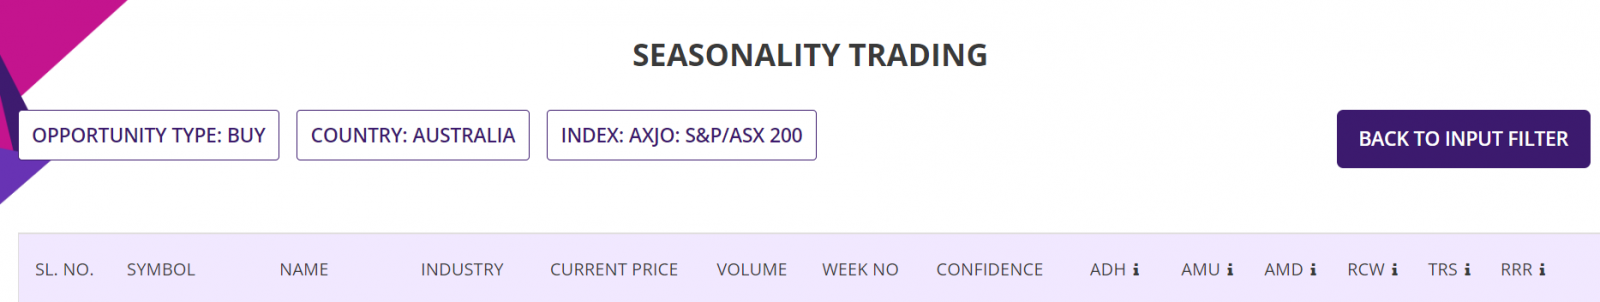
Country in focus:
This week we look at the Stocks from AUSTRALIA in ASX200 index, the index which is made up of top 200 Stocks of Australian Stock market, in form of market capitalisation.
Stock/ETF in focus:
Specific Stock in focus CSR Limited (Ticker: CSR). The Stock is listed in the Australian Stock Exchange (ASX), trading currency being Australian Dollars or AUD.
Trade Direction:
BULLISH, Seasonality study for last 10 years since 2013 reveal 90.0% probability of success in a BUY (LONG) trade for this week and 90% probability for the trade next week (Week 4) and the week after (Week 5). Please see the Summary report screenshot later in the blog.
What is Seasonality trading strategy? Please watch this short video to understand what is it and how you can put Probability on your side with Stock market Seasonality. Probability and Risk-Reward Ratio (RRR) are the two best friends of a trader.
Overview:
CSR Limited, together with its subsidiaries, engages in the manufacture and supply of building products for residential and commercial constructions in Australia and New Zealand. CSR Limited was founded in 1855 and is headquartered in North Ryde, Australia.
It operates through Building Products, Property, and Aluminium segments. The Building Products segment offers interior systems, including gyprock plasterboards, Martini acoustic insulation products, and Rondo rolled formed steel products, as well as Himmel and Potter interior systems that supplies ceiling tiles, aluminium partitions, and architectural hardware products; construction systems, such as Hebel autoclaved aerated concrete products, AFS walling systems, cladding systems, and Cemintel fiber cement; masonry and insulation solutions comprising Bradford insulations, Bradford energy solutions, Edmonds ventilation systems, and Monier roofing solutions; and bricks, including PGH Bricks and pavers. The company's Property segment sells former operating sites. This segment is also involved in the large-scale developments in New South Wales, Queensland, and Victoria. Its Aluminium segment offers aluminium ingots, billets, and slabs.
(Courtesy: Yahoo Finance)
Sector and Industry Details:
Sector(s): Industrials
Industry: Building Products & Equipment
Full Time Employees: 2,573
(Courtesy: Yahoo Finance)
Fundamentals:
52 Week Range 3.93 - 6.31
Avg. Volume 1,835,347
Market Cap 2.433B
Beta (5Y Monthly) 0.76
PE Ratio (TTM) 11.31
EPS (TTM) 0.45
Earnings Date Nov 04, 2022
Ex-Dividend Date Nov 09, 2022
1y Target Estimate 5.43
(Courtesy: Yahoo Finance)
Current trading price:
As of Friday, close of 13th January 2023, the stock was trading at 5.09. All prices are in AUD.
SEASONALITY:
The stock demonstrated very strong Seasonal move in week 3 of the year, here are some of the details of its Seasonal behaviour.
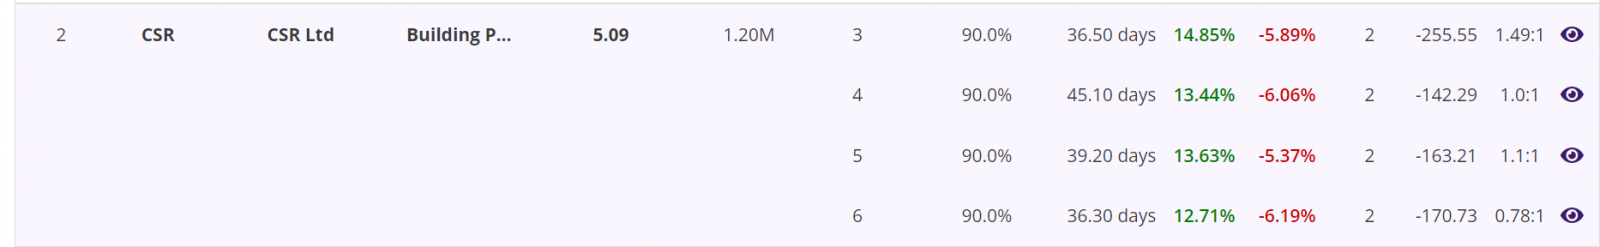
Summary report: In 9 out of last 10 years in week 3, the stock was BULLISH with average move up (AMU) of 14.85% and average move down (AMD) of 5.89% for an average holding time (ADH) of about 37 days. The worst-case average Reward-Risk Ratio (RRR) for all 10 trades over last 10 years was 1.49:1. See the summary report table below:
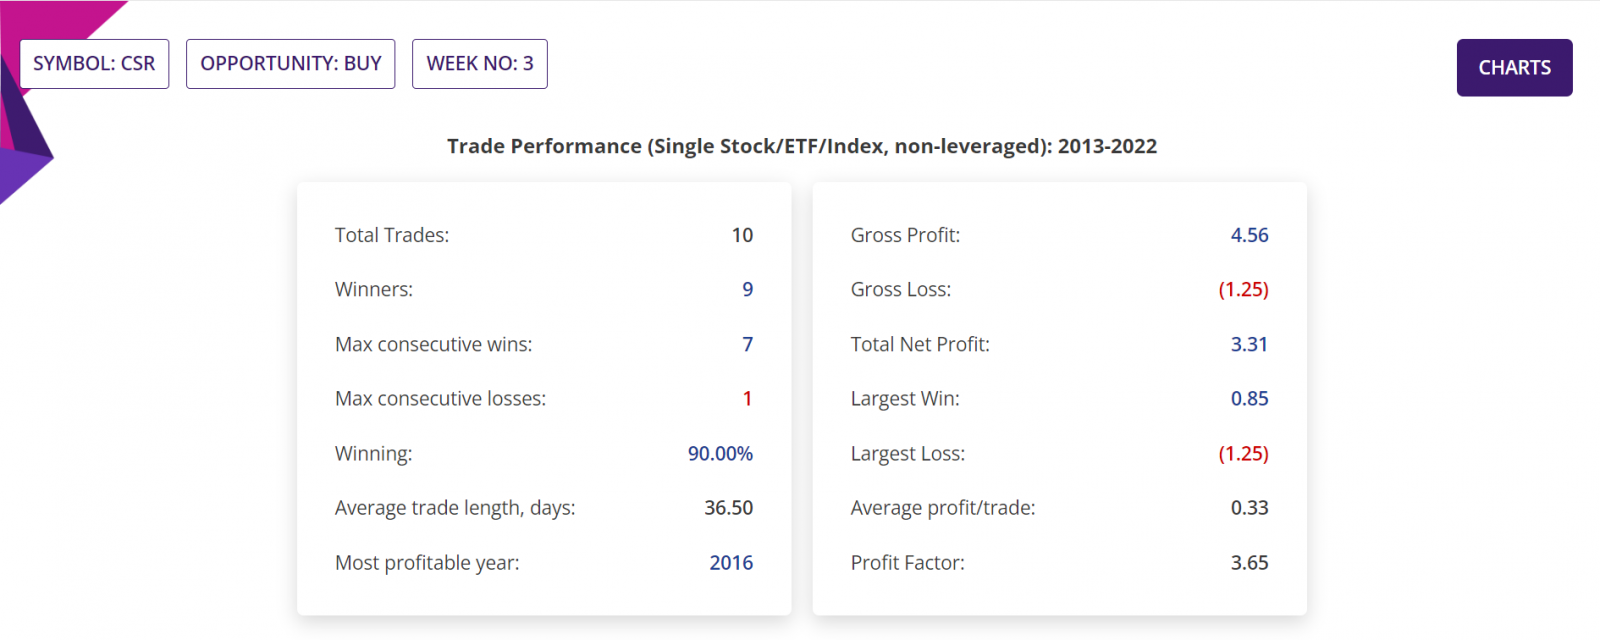
Detailed Report, Trade Performance: If 10,000 stocks were bought in the beginning of week 3 every year for last 10 years, then a trader would have had a Gross Profit of AUD45,600, Gross Loss of AUD12,500, making a Total Net Profit of AUD33,100.
In those 10 years, the Largest Win was AUD8,500, Largest Loss is AUD12,500, which is the only loss in last 10 years and the Average profit/trade being AUD3,300. Profit factor (quotient of Gross Profit and Gross Loss) being 3.65. All figures excluding trading commissions. Please see the section of the detailed report below.
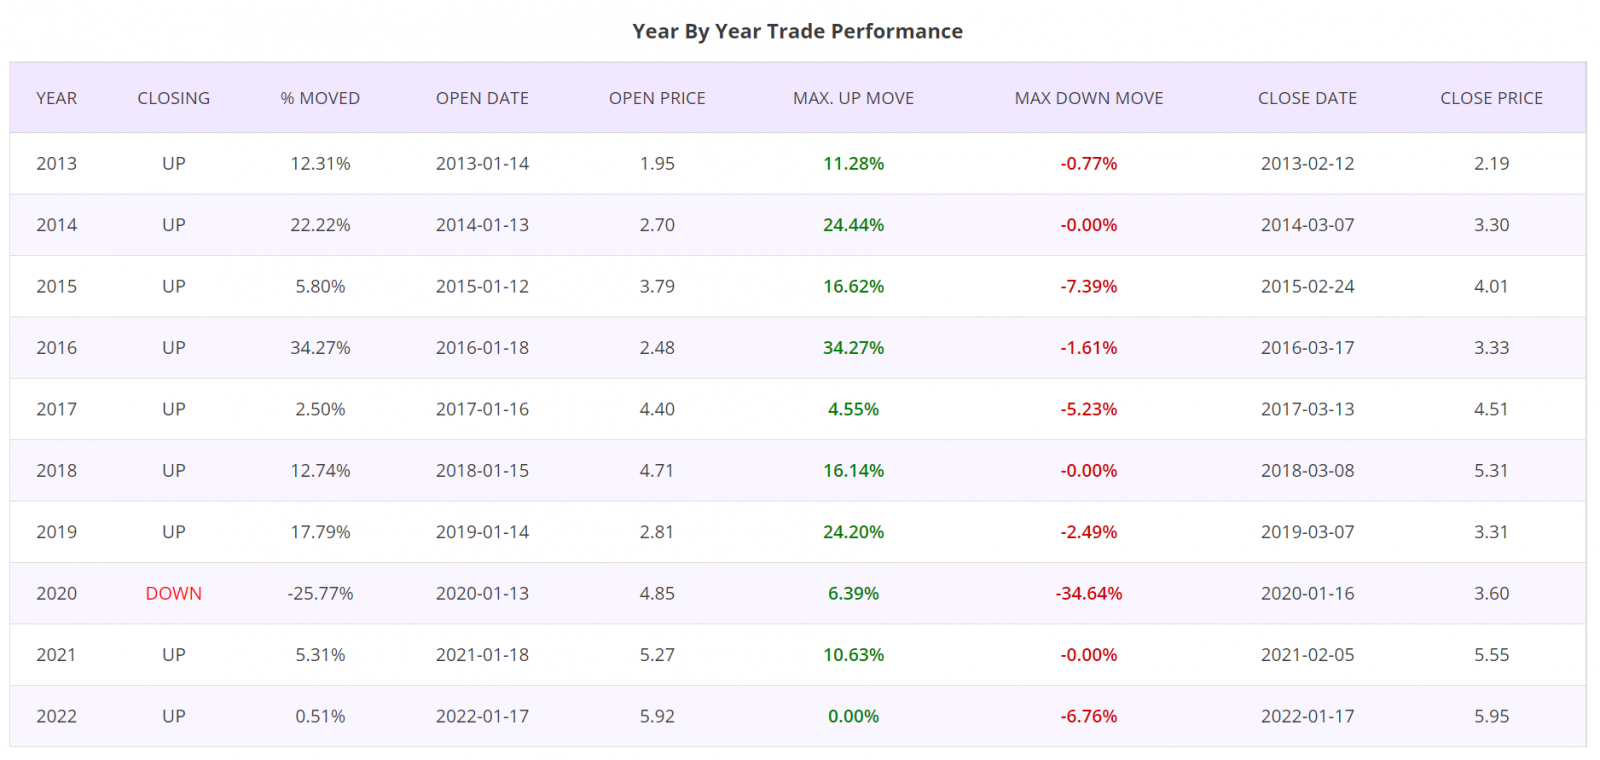
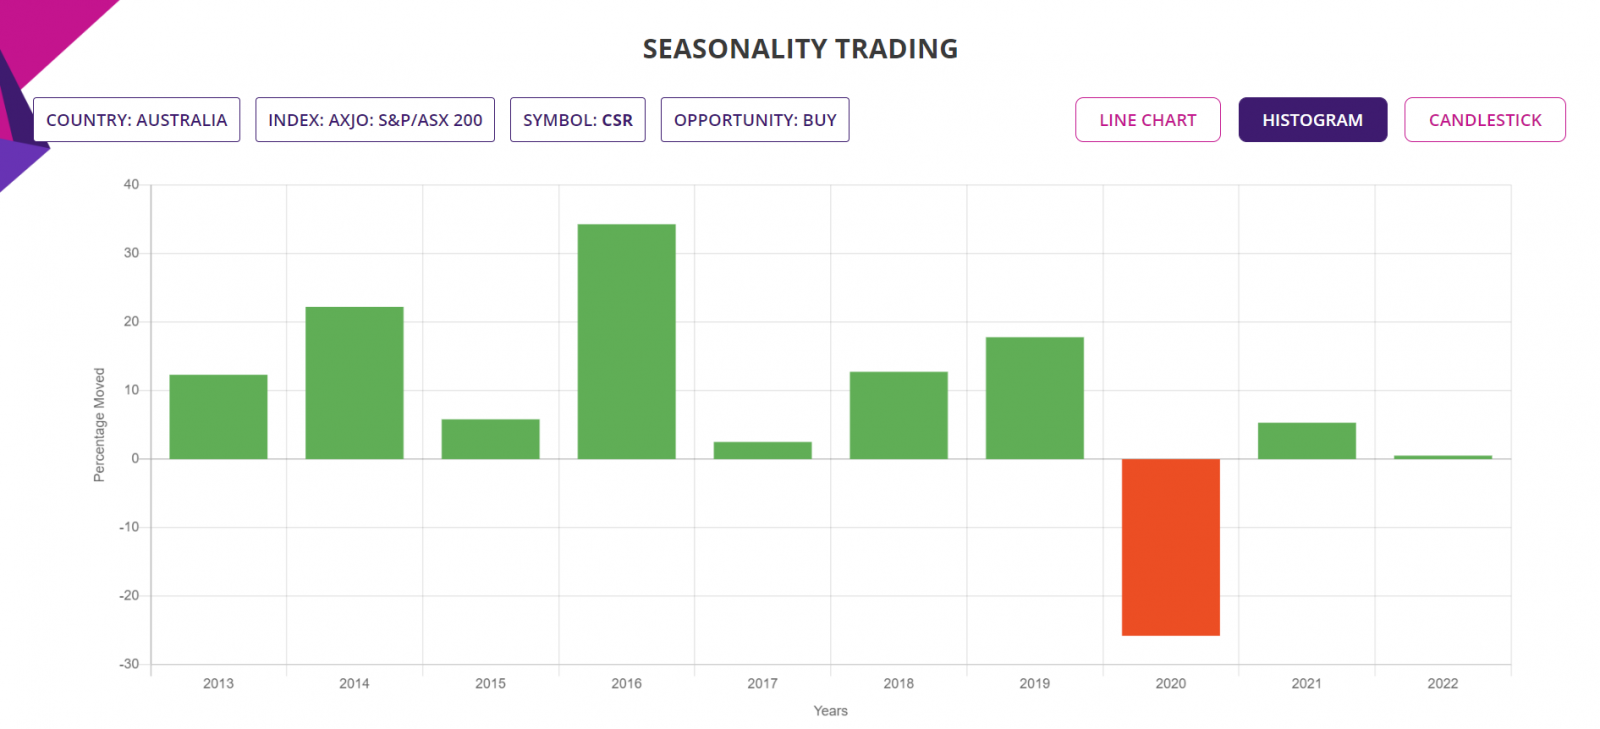
Detailed Report, Year by Year Trade Performance: Trades taken at the beginning of Week 3 for all years of last 10 years was winners, except for the year 2020, the year which is marked by meltdown of stock markets around the world with average drop of stock prices in excess of 30%. Prior to year 2020 and since that year, the Stock was always a winner in Week 3 of the year. Please see the section of the detailed report below.
Histogram Chart: The chart below shows the percentage moves of the underlying Stock of Interest in each of the years in the Seasonality analysis, for a quick visual clue of the year-by-year trade performance.
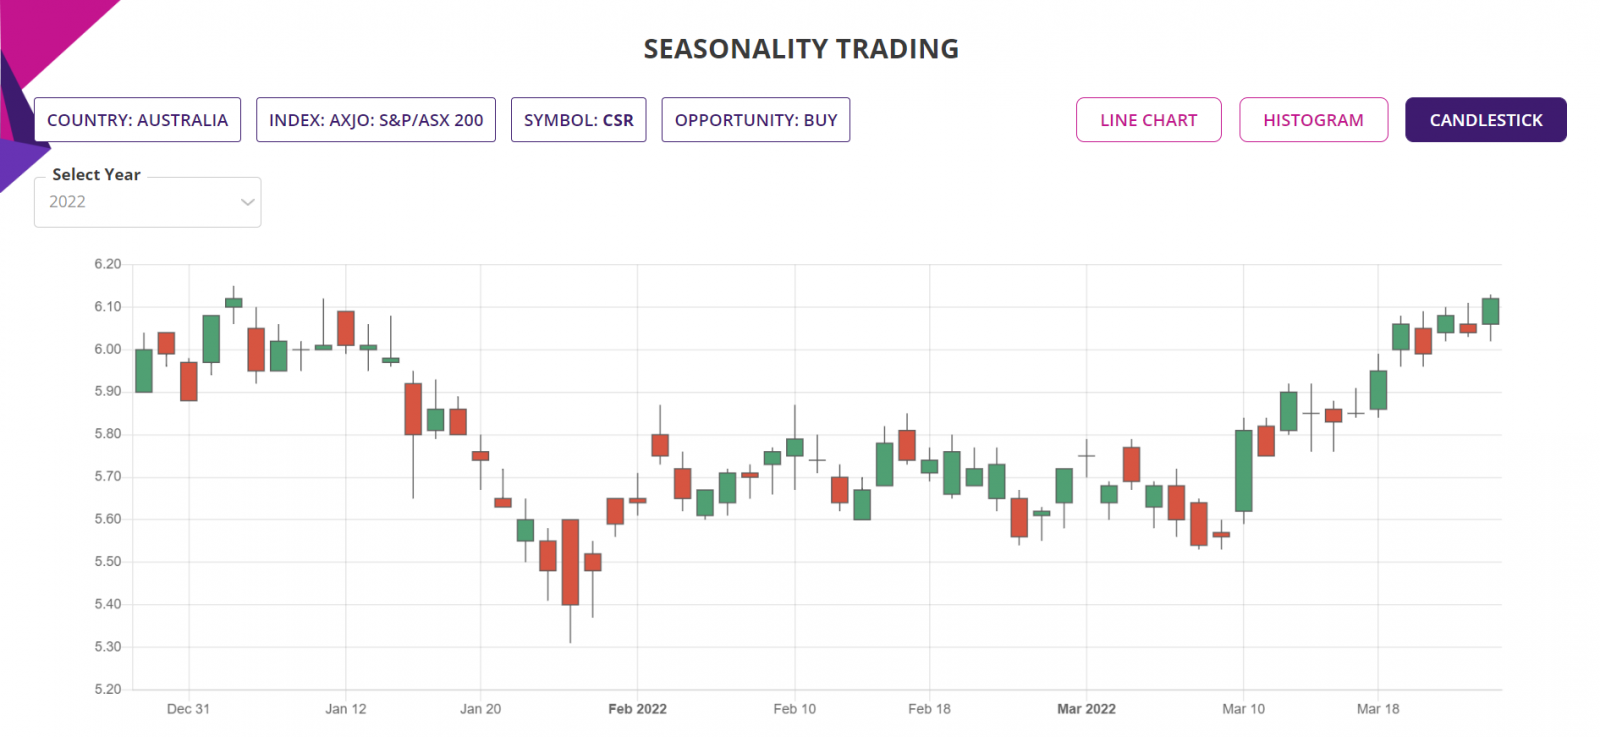
Candlestick Chart: The candlestick chart of the underlying Stock/ETF’s latest performance is as shown below. In the web-based Seasonality trading application, the chart is available for all the years of the Seasonality analysis.
Trade Structure:
If we had traded the Stock this week, then we would have structured the trade as follows:
|
TRADE STRUCTURE (All prices in Australian Dollars or AUD) |
||
|
Stock price |
$5.09 |
AU$ |
|
CFDs |
10,000 |
Number of Stocks used for this CFD trde |
|
Leverage |
10 |
CFD leverage |
|
|
|
|
|
Margin required |
$5,090.00 |
Amount of fund required for the trade |
|
|
|
|
|
Target Stock price (TP) |
$5.55 |
10% above the current price |
|
Stop Stock price (SL) |
$4.89 |
5% below the current price |
|
|
|
|
|
Profit Target |
$4,581.00 |
Limit order placed at underlying price of TP |
|
Stop Loss |
$2,036.00 |
Guaranteed stop at SL price |
|
Return on Investment (RoI) |
90% |
|
The choice of RRR of 2:25 is in line with the expected RRR from the last 10 trades in each of the last 10 years in Week 3, since 2013 till 2022.
The extraordinary high RoI is achieved by trading the Stock as CFD where the broker allows a leverage of 10:1. So there will be interest payable on CFD funding, usually at the rate of 90 days bank bill rate PLUS 2%, calculated daily for the duration the trade is held. The above table is a simplistic view of the trade profitability without considering the CFD interest and trading commissions or any other costs.
Further Information about trading applications:
Please visit the following URL for more information on various trading applications from Sapphire Capitals which are designed to deliver high probability trading opportunities for swing trading as well as for intraday trading:
https://www.sapphirecapitals.com/pages/swing-trading-stock-seasonality-strategy/
https://www.sapphirecapitals.com/pages/swing-trading-stock-price-action-strategy/
https://www.sapphirecapitals.com/pages/swing-trading-volume-spike-stock-trading-strategy/
https://www.sapphirecapitals.com/pages/day-trading-intraday-seasonality-trading/
Disclaimer:
Sapphire Private Assets (ABN: 34 613 892 023, trading as Sapphire Capitals) is not a broker or a financial adviser but an education and research organisation; we provide training and tools for traders and DIY fund managers for trading in global financial markets. The contents of the blog have been produced by using technical analysis and trading applications developed by Sapphire Capitals for the Stock and ETF traded worldwide. The contents of this blog are intended for education and research purposes only and is not a recommendation or solicitation to invest in any Stock or ETF.
For more details, please visit www.sapphirecapitals.com/Disclaimer.


