
-
 Admin123 :
Admin - Sapphire Capitals
Admin123 :
Admin - Sapphire Capitals -
 Date :
2022-12-04
Date :
2022-12-04
Stock In Focus - Week 49 (2022) – INDIA – SEASONALITY TRADING STRATEGY
The week beginning Monday, the 5th November is Week 49 as per ISO numbering convention of the weeks of a year.
Country in focus:
This week we look at the Stocks from INDIA in NIFTY 50 index.
Stock/ETF in focus:
Specific Stock in focus Tata Consultancy Services Limited (Ticker: TCS). The Stock is listed in the National Stock Exchange (NSE), trading currency being Indian Rupees or INR.
Trade Direction:
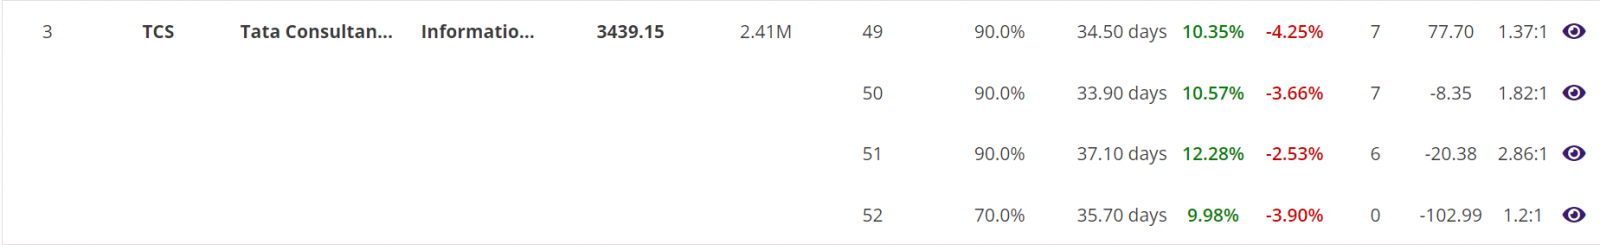
BULLISH, Seasonality study for last 10 years reveal 90.0% probability of success in a BUY (LONG) trade for this week and 90% probability for the trade next week (Week 50) and the week after (Week 51). Please see the Summary report screenshot later in the blog.
Overview:
Tata Consultancy Services Limited provides information technology (IT) and IT enabled services worldwide. The company was founded in 1968 and is headquartered in Mumbai, India. Tata Consultancy Services Limited is a subsidiary of Tata Sons Private Limited.
The company operates through Banking, Financial Services and Insurance; Manufacturing; Retail and Consumer Business; Communication, Media and Technology; Life Sciences and Healthcare; and Others segments. It offers CHROMA, a cloud-based talent management solution; ignio, a cognitive automation software; TCS iON, an assessment platform; TAP, a procurement offering; TCS MasterCraft, a platform to automate and manage IT processes; Quartz, a blockchain solution; and TCS OmniStore, a commerce platform. The company also provides customer intelligence and insight solutions; Intelligent Urban Exchange, a smart city solution; OPTUMERA, a merchandise optimization platform; TwinX, an AI powered system of actionable intelligence for business leaders to simulate and optimize enterprise decisions; TCS BaNCS, a financial platform; and Jile, an agile DevOps platform. In addition, it offers drug development and connected intelligent platforms; ERP on cloud, an enterprise solution; and HOBS, a platform for subscription based digital business. Further, the company provides cognitive business, consulting, analytics and insights, automation and artificial intelligence, Internet of Things, cloud, blockchain, cyber security, interactive, digital and quality engineering, sustainability, and enterprise application services. It serves banking, financial, and public services; capital market; consumer goods and distribution; education; insurance; life sciences and healthcare; manufacturing, retail; hi-tech; travel, transportation, and hospitality industries; communications, media, and technology industries; and energy, resource, and utility industries. Further, the company has collaboration with Microsoft to build autonomous solutions.
(Courtesy: Yahoo Finance)
Sector and Industry Details:
Sector(s): Technology
Industry: Information Technology Services
Full Time Employees: 616,171
(Courtesy: Yahoo Finance)
Fundamentals:
52 Week Range 2,926.10 - 4,043.00
Avg. Volume 2,016,016
Market Cap 12.584T
PE Ratio (TTM) 31.94
EPS (TTM) 107.66
Earnings Date Jan 09, 2023
Ex-Dividend Date Oct 17, 2022
(Courtesy: Yahoo Finance)
Current trading price:
As of Friday, close of 2nd November 2022, the stock was trading at 3,439.15. All prices are in INR.
SEASONALITY:
The stock demonstrated very strong SEASONAL move in week 49 of the year, here are some of the details of its SEASONAL behaviour.
Summary report: In 9 out of last 10 years in week 49, the stock was BULLISH with average move up (AMU) of 10.35% and average move down (AMD) of 4.25% for an average holding time (ADH) of 34.5 days. The worst-case average Reward-Risk Ratio (RRR) for all 10 trades over last 10 years was 1.37:1. See the summary report table below:

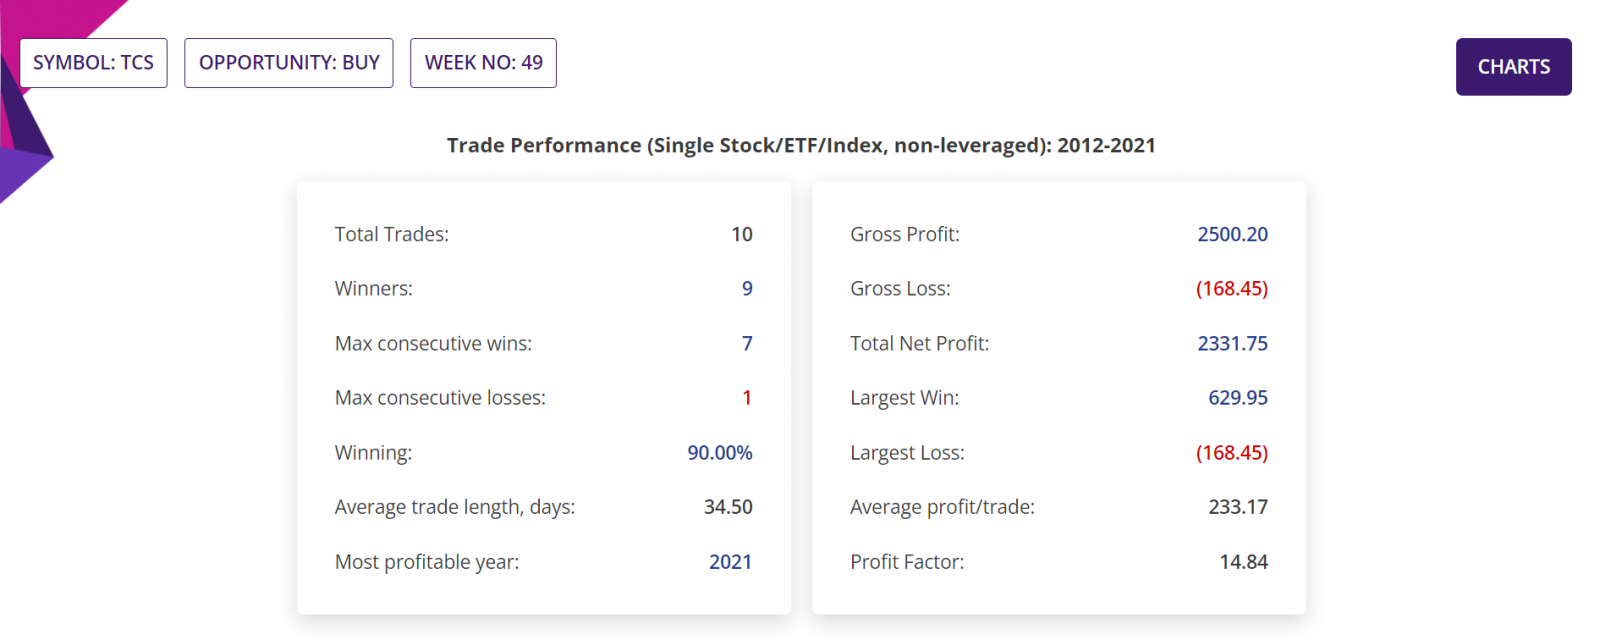
Detailed Report, Trade Performance: If 100 stocks were bought in the beginning of week 49 every year for last 10 years, then a trader would have had a Gross Profit of INR2,50,020, Gross Loss of INR16,845, making a Total Net Profit of INR2,33,175.
In those 10 years, the Largest Win was INR62,995, Largest Loss is INR16,845, the Average profit/trade being INR23,317. Profit factor (quotient of Gross Profit and Gross Loss) being 14.84. All figures excluding trading commissions. Please see the section of the detailed report below.
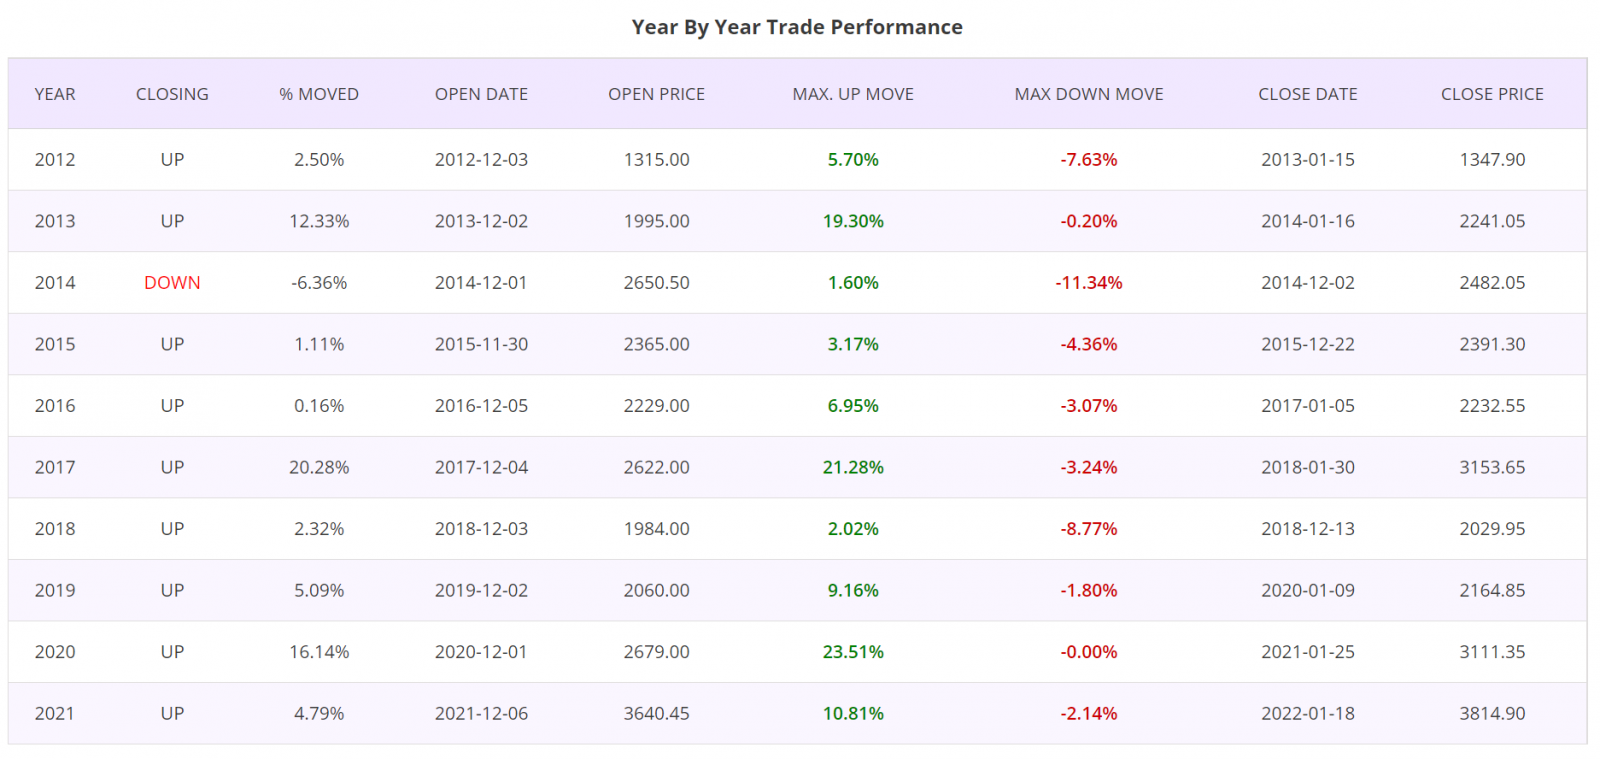
Detailed Report, Year by Year Trade Performance: Trades taken at the beginning of Week 49 for all years of last 10 years was winners, except for the year 2014. Please see the section of the detailed report below.
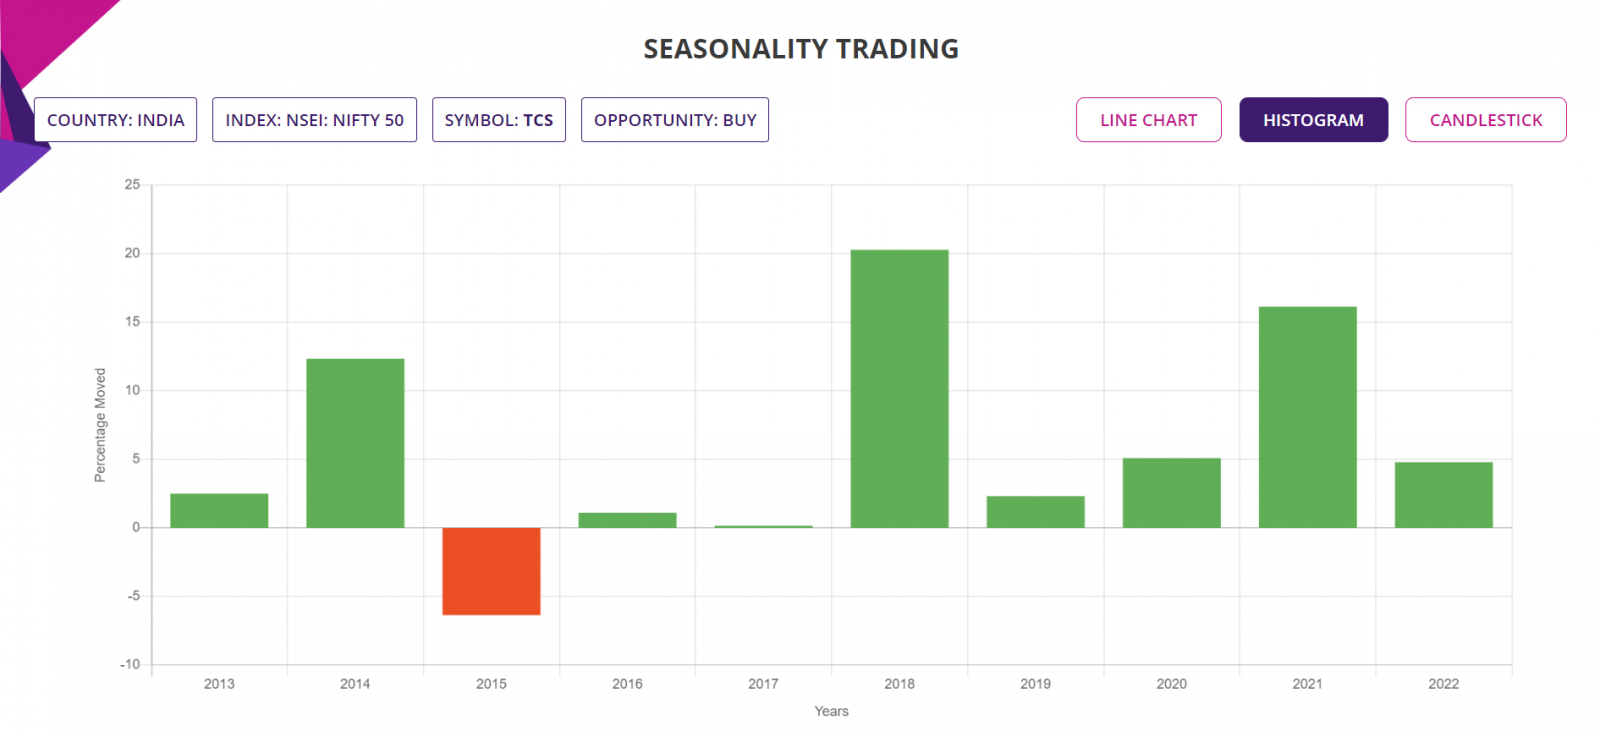
Histogram Chart: The chart below shows the percentage moves of the underlying Stock of Interest in each of the years in the Seasonality analysis, for a quick visual clue of the year-by-year trade performance.
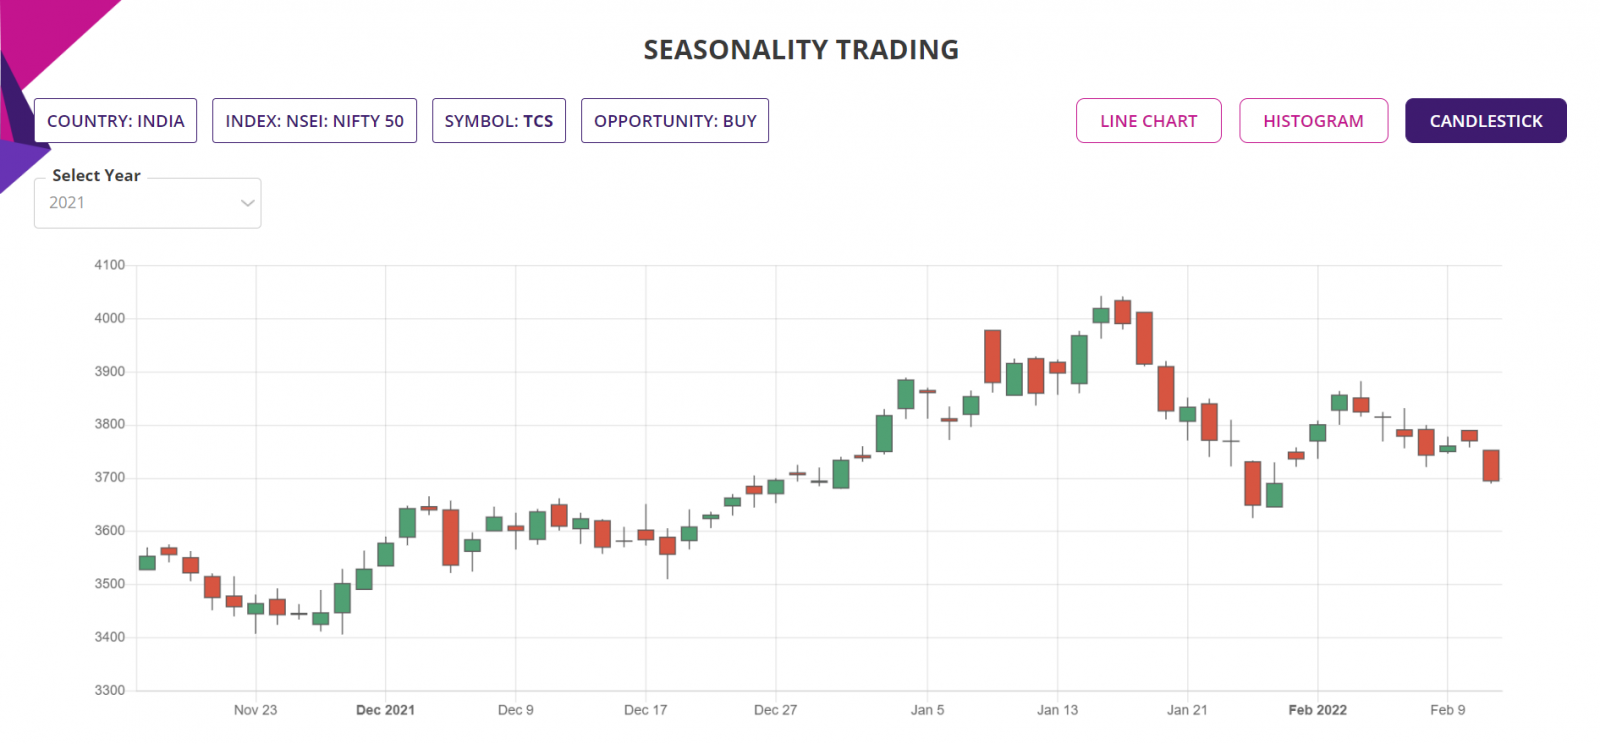
Candlestick Chart: The candlestick chart of the underlying Stock/ETF’s latest performance is as shown below. In the web-based Seasonality trading application, the chart is available for all the years of the Seasonality analysis.
Trade Structure:
If we had traded the Stock this week, then we would have structured the trade as follows:
|
TRADE STRUCTURE (All prices in Indian Rupees or INR) |
||
|
Stock price |
3,439.15 |
Assuming trade placed at last traded price |
|
Stocks |
100 |
Number of Stocks used for this trade |
|
Investment required |
343,915 |
Amount of fund required for the trade |
|
|
|
|
|
Target Stock price (TP) |
3,783.07 |
10% above the current price |
|
Stop Stock price (SL) |
3,267.19 |
5% below the current price |
|
|
|
|
|
Profit Target |
34,392 |
Limit order placed at underlying TP price |
|
Stop Loss |
17,196 |
Guaranteed stop at SL price |
The choice of RRR of 2:1 is in line with the worst-case average RRR from the last 10 trades in each of the last 10 years in Week 49, since 2012 till 2021.
Further Information about trading applications:
Please visit the following URL for more information on various trading applications from Sapphire Capitals which are designed to deliver high probability trading opportunities for swing trading as well as for intraday trading:
https://www.sapphirecapitals.com/pages/swing-trading-stock-seasonality-strategy/
https://www.sapphirecapitals.com/pages/swing-trading-stock-price-action-strategy/
https://www.sapphirecapitals.com/pages/swing-trading-volume-spike-stock-trading-strategy/
https://www.sapphirecapitals.com/pages/day-trading-intraday-seasonality-trading/
Disclaimer:
Sapphire Private Assets (ABN: 34 613 892 023, trading as Sapphire Capitals) is not a broker or a financial adviser but an education and research organisation; we provide training and tools for traders and DIY fund managers for trading in global financial markets. The contents of the blog have been produced by using technical analysis and trading applications developed by Sapphire Capitals for the Stock and ETF traded worldwide. The contents of this blog are intended for education and research purposes only and is not a recommendation or solicitation to invest in any Stock or ETF.
For more details, please visit www.sapphirecapitals.com/Disclaimer.


