
-
 Admin123 :
Admin - Sapphire Capitals
Admin123 :
Admin - Sapphire Capitals -
 Date :
2022-11-20
Date :
2022-11-20
Stock In Focus - Week 47 (2022) – USA – SEASONALITY TRADING STRATEGY
The week beginning Monday, the 21st November is Week 47 as per ISO numbering convention of the weeks of a year.
Country in focus:
This week we look at the Stocks from USA in GSPC: S&P 500 index.
Stock/ETF in focus:
Specific Stock in focus Deere & Company (Ticker: DE). The Stock is listed in the New York Stock Exchange (NYSE), trading currency being Currency USD.
Trade Direction:
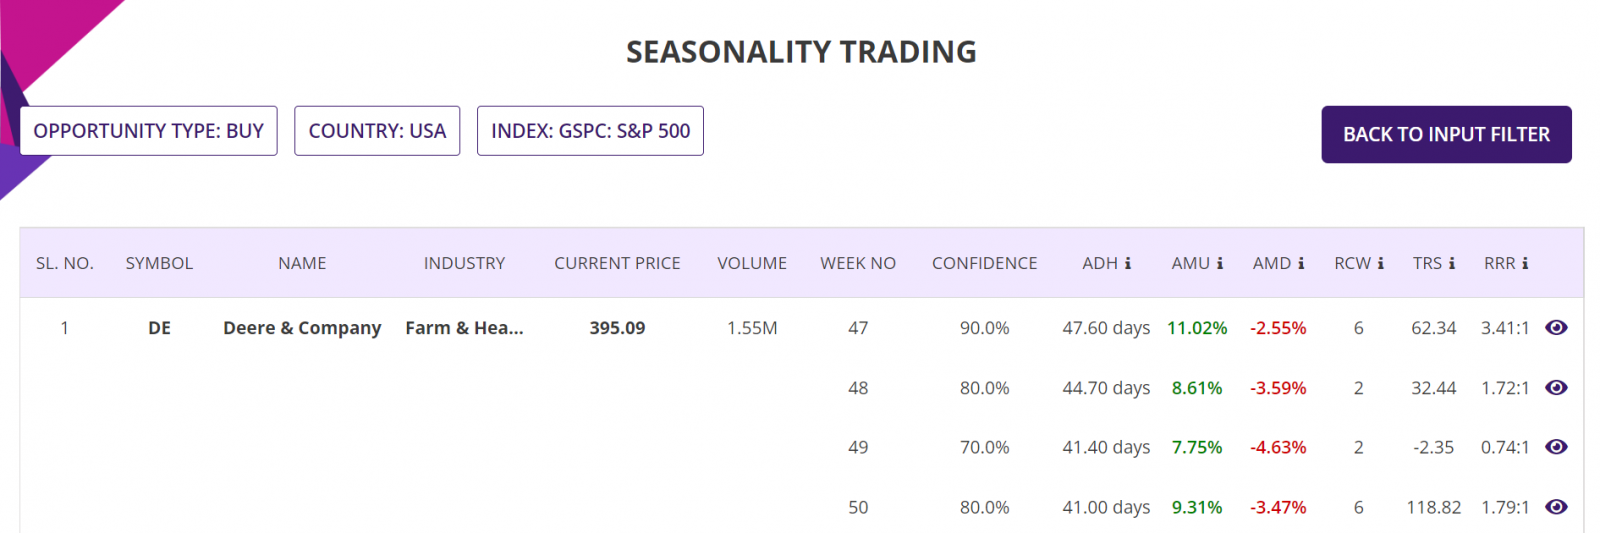
BULLISH, Seasonality study for last 10 years reveal 90.0% probability of success in a BUY (LONG) trade for this week and 80% probability for the trade next week (Week 48). Please see the Summary report screenshot later in the blog.
Overview:
Deere & Company manufactures and distributes various equipment worldwide. Deere & Company was founded in 1837 and is headquartered in Moline, Illinois.
The company operates through four segments: Production and Precision Agriculture, Small Agriculture and Turf, Construction and Forestry, and Financial Services. The Production and Precision Agriculture segment provides mid-size tractors, combines, cotton pickers and strippers, sugarcane harvesters, harvesting front-end equipment, sugarcane loaders, pull-behind scrapers, and tillage and seeding equipment, as well as application equipment, including sprayers and nutrient management, and soil preparation machinery for grain growers. The Small Agriculture and Turf segment offers utility tractors, and related loaders and attachments; turf and utility equipment, including riding lawn equipment, commercial mowing equipment, golf course equipment, and utility vehicles, as well as implements for mowing, tilling, snow and debris handling, aerating, residential, commercial, golf, and sports turf care applications; other outdoor power products; and hay and forage equipment. This segment also resells products from other manufacturers. It serves dairy and livestock producers, crop producers, and turf and utility customers. The Construction and Forestry segment provides a range of backhoe loaders, crawler dozers and loaders, four-wheel-drive loaders, excavators, motor graders, articulated dump trucks, landscape and skid-steer loaders, milling machines, pavers, compactors, rollers, crushers, screens, asphalt plants, log skidders, log feller bunchers, log loaders and forwarders, log harvesters, and attachments; and roadbuilding equipment. The Financial Services segment finances sales and leases agriculture and turf, and construction and forestry equipment. It also offers wholesale financing to dealers of the foregoing equipment; and extended equipment warranties, as well as finances retail revolving charge accounts.
(Courtesy: Yahoo Finance)
Sector and Industry Details:
Sector: Industrials
Industry: Farm & Heavy Construction Machinery
Full Time Employees: 75,550
(Courtesy: Yahoo Finance)
Fundamentals:
52 Week Range 283.81 - 446.76
Avg. Volume 1,431,826
Market Cap 125.032B
PE Ratio (TTM) 20.70
EPS (TTM) 20.01
Earnings Date Nov 23, 2022
Ex-Dividend Date Sep 29, 2022
1y Target Est 401.91
(Courtesy: Yahoo Finance)
Current trading price:
As of Friday, close of 18th November 2022, the stock was trading at 414.26. All prices are in USD.
SEASONALITY:
The stock demonstrated very strong SEASONAL move in week 47 of the year, here are some of the details of its SEASONAL behaviour.
Summary report: In 9 out of last 10 years in week 47, the stock was BULLISH with average move up (AMU) of 11.02% and average move down (AMD) of 2.55% for an average holding time (ADH) of 48 days. The worst-case average Reward-Risk Ratio (RRR) for all 10 trades over last 10 years was 3.41:1. See the summary report table below:
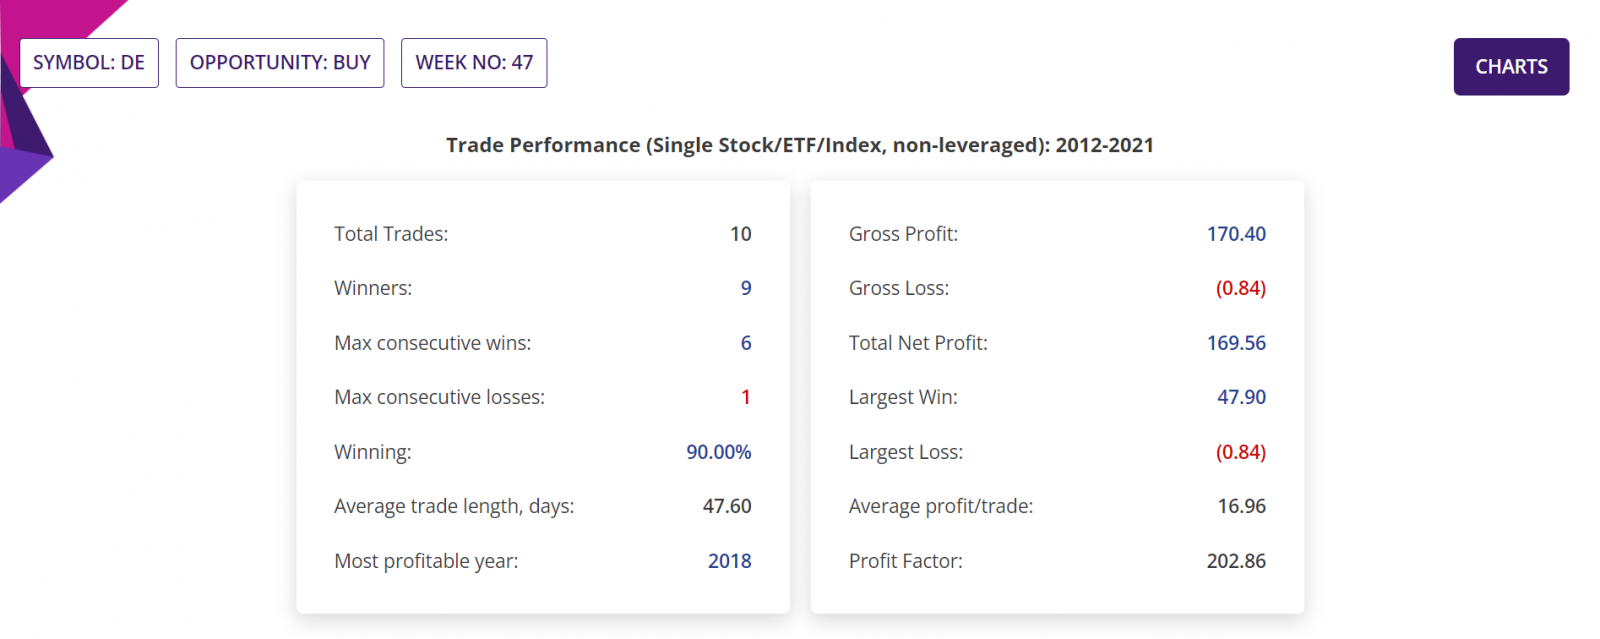
Detailed Report, Trade Performance: If only 100 stocks were bought in the beginning of week 47 every year for last 10 years, then a trader would have had a Gross Profit of USD17,040, Gross Loss of only USD84, making a Total Net Profit of USD16,956. No leverage applied.
In those 10 years, the Largest Win was USD4,790, Largest Loss was US84, the Average profit/trade being USD1,696. Profit factor (quotient of Gross Profit and Gross Loss) being 202.86. All figures excluding trading commissions. Please see the section of the detailed report below.
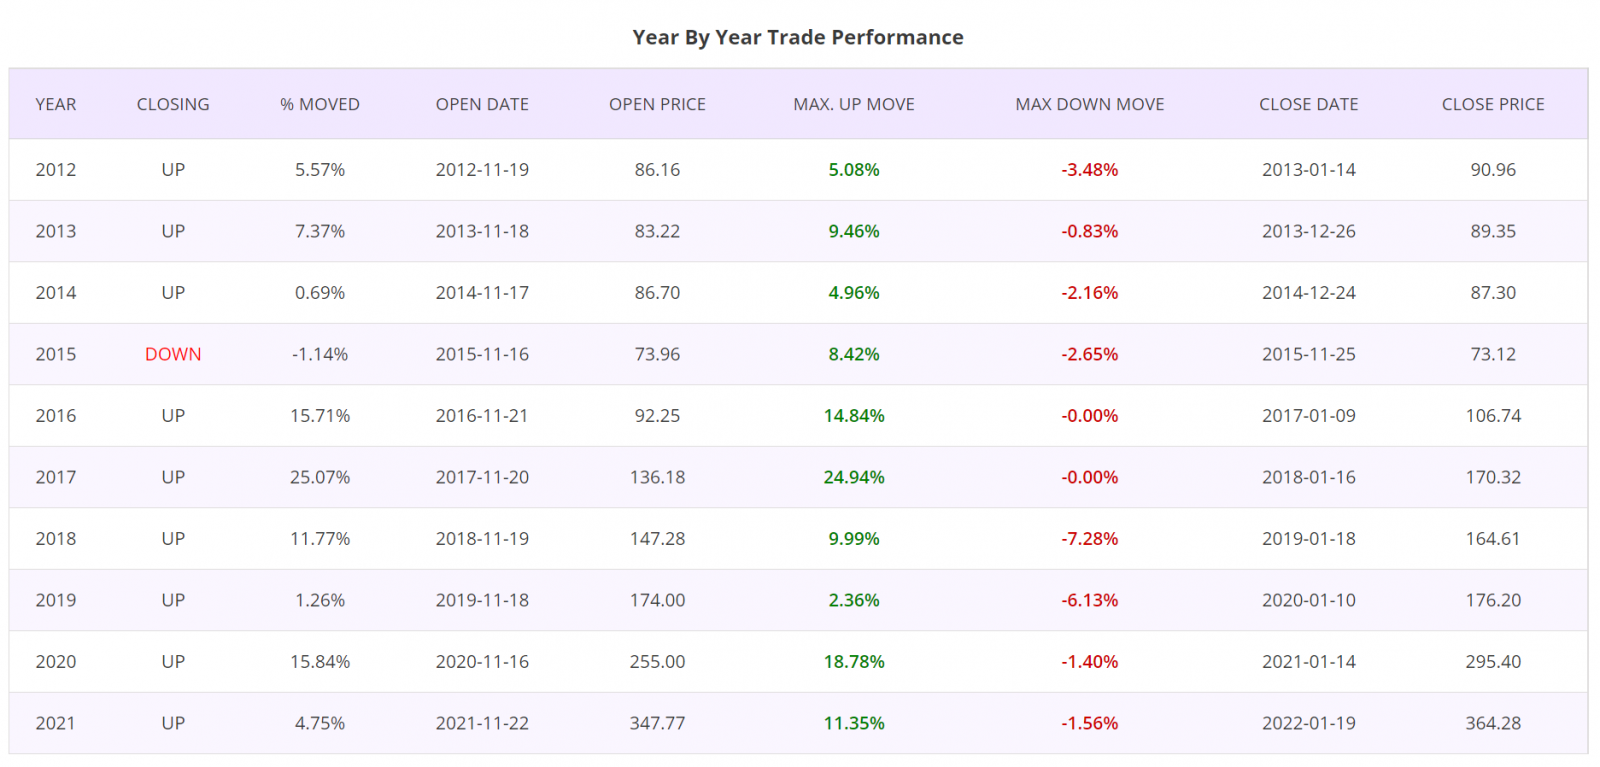
Detailed Report, Year by Year Trade Performance: Trades taken at the beginning of Week 47 for all years of last 10 years were winners, except for the year 2015 in which there was a very small loss. Please see the section of the detailed report below.
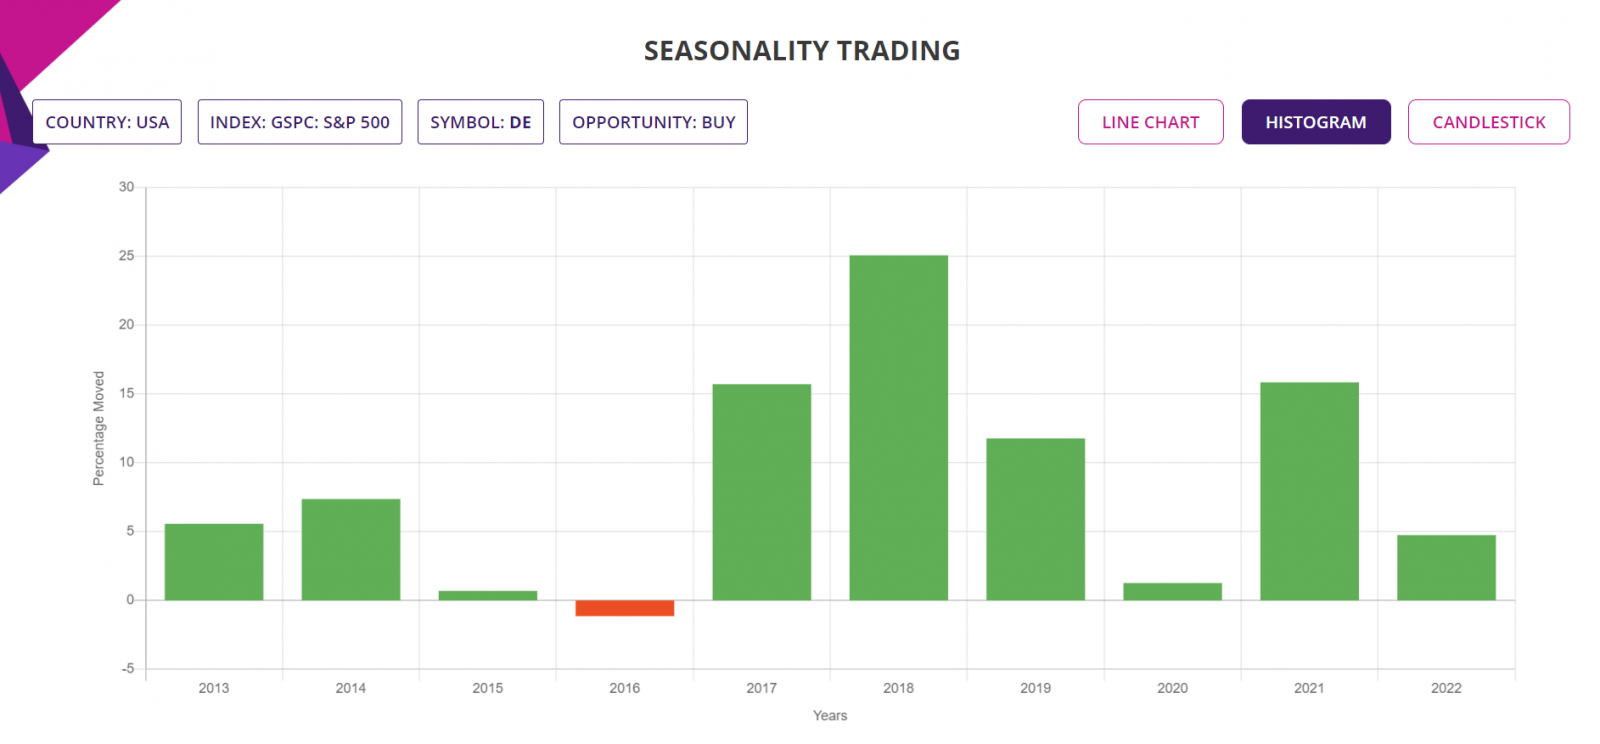
Histogram Chart: The chart below shows the percentage moves of the underlying Stock of Interest in each of the years in the Seasonality analysis, for a quick visual clue of the year-by-year trade performance.
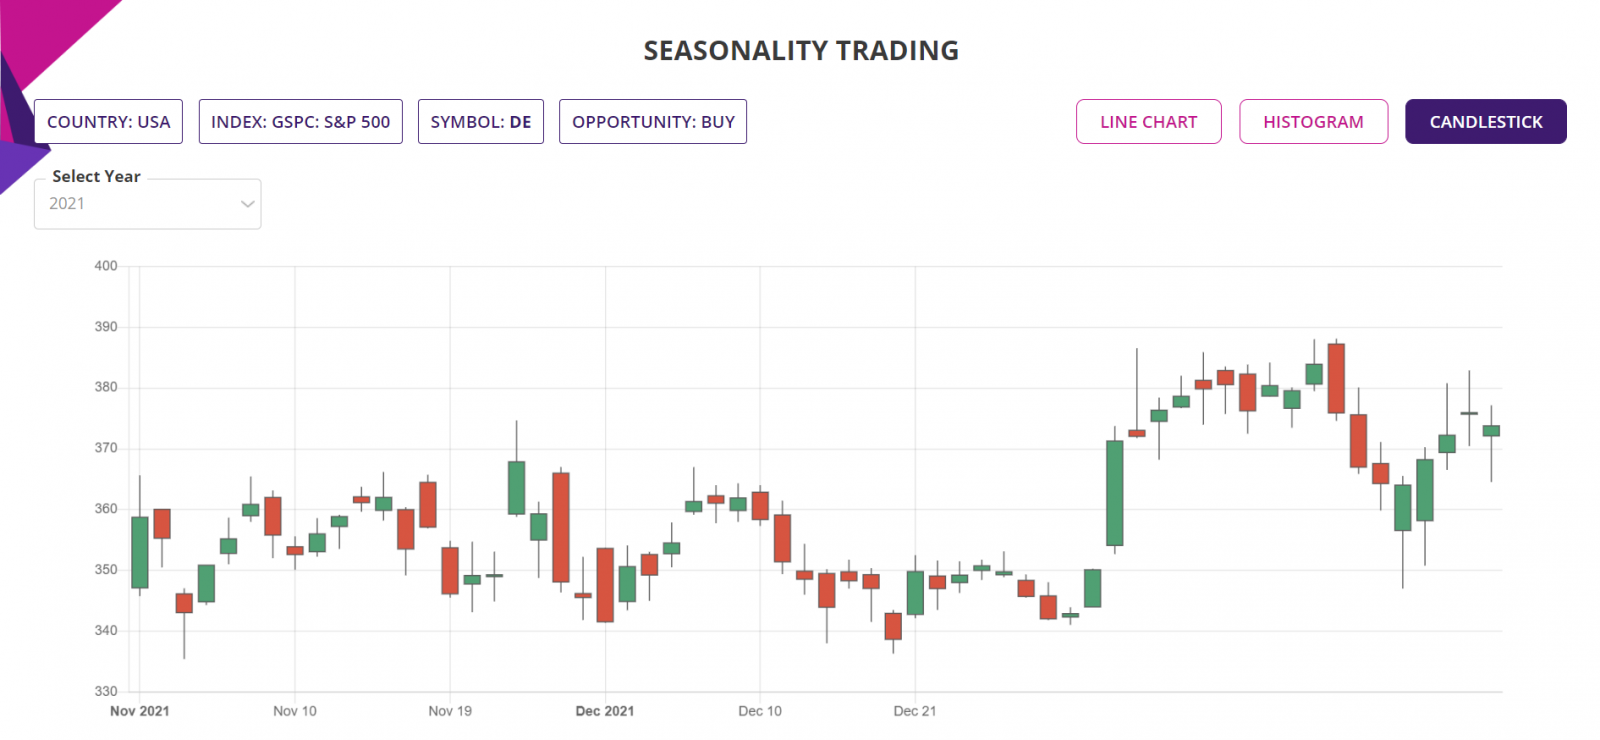
Candlestick Chart: The candlestick chart of the underlying Stock/ETF’s latest performance is as shown below. In the web-based Seasonality trading application, the chart is available for all the years of the Seasonality analysis.
Trade Structure:
If we had traded the Stock this week, then we would have structured the trade as follows:
|
TRADE STRUCTURE (All prices in USD) |
||
|
Stock price |
414.26 |
Assuming trade placed at last traded price |
|
Stocks |
100 |
Number of Stocks used for this trade |
|
Investment required |
41,426 |
Amount of fund required for the trade |
|
|
|
|
|
Target Stock price (TP) |
455.69 |
10% above the current price |
|
Stop Stock price (SL) |
401.83 |
3% below the current price |
|
|
|
|
|
Profit Target |
4,143 |
Limit order placed at underlying TP price |
|
Stop Loss |
1,243 |
Guaranteed stop at SL price |
The choice of RRR of 3.33:1 is in line with the worst-case average RRR from the last 10 trades in each of the last 10 years in Week 47, since 2012 till 2021.
Please note that the RoI of return on investment is 10% minus commissions etc. US has a very liquid Options market. So an Options trade such as debit or credit spread can take advantage of the potential bullish move of the underlying Stock and can dramatically increase the RoI in the vicinity of 200% to 300% and correspondingly reduce the trading capital at risk.
Further Information about trading applications:
Please visit the following URL for more information on various trading applications from Sapphire Capitals which are designed to deliver high probability trading opportunities for swing trading as well as for intraday trading:
https://www.sapphirecapitals.com/pages/swing-trading-stock-seasonality-strategy/
https://www.sapphirecapitals.com/pages/swing-trading-stock-price-action-strategy/
https://www.sapphirecapitals.com/pages/swing-trading-volume-spike-stock-trading-strategy/
https://www.sapphirecapitals.com/pages/day-trading-intraday-seasonality-trading/
Disclaimer:
Sapphire Private Assets (ABN: 34 613 892 023, trading as Sapphire Capitals) is not a broker or a financial adviser but an education and research organisation; we provide training and tools for traders and DIY fund managers for trading in global financial markets. The contents of the blog have been produced by using technical analysis and trading applications developed by Sapphire Capitals for the Stock and ETF traded worldwide. The contents of this blog are intended for education and research purposes only and is not a recommendation or solicitation to invest in any Stock or ETF.
For more details, please visit www.sapphirecapitals.com/Disclaimer.


