
-
 Admin123 :
Admin - Sapphire Capitals
Admin123 :
Admin - Sapphire Capitals -
 Date :
2022-11-06
Date :
2022-11-06
Stock of interest - Week 45 (2022) – USA – PRICE ACTION TRADING STRATEGY
The week beginning Monday, the 7th November is Week 45 as per ISO numbering convention of the weeks of a year.
Country in focus:
This week we look at the Stocks from USA in GSPC: S&P 500 index.
Stock/ETF in focus:
Specific Stock in focus is CF Industries Holdings, Inc. (Ticker: CF). The trading currency is US Dollar or USD.
Trade Direction:
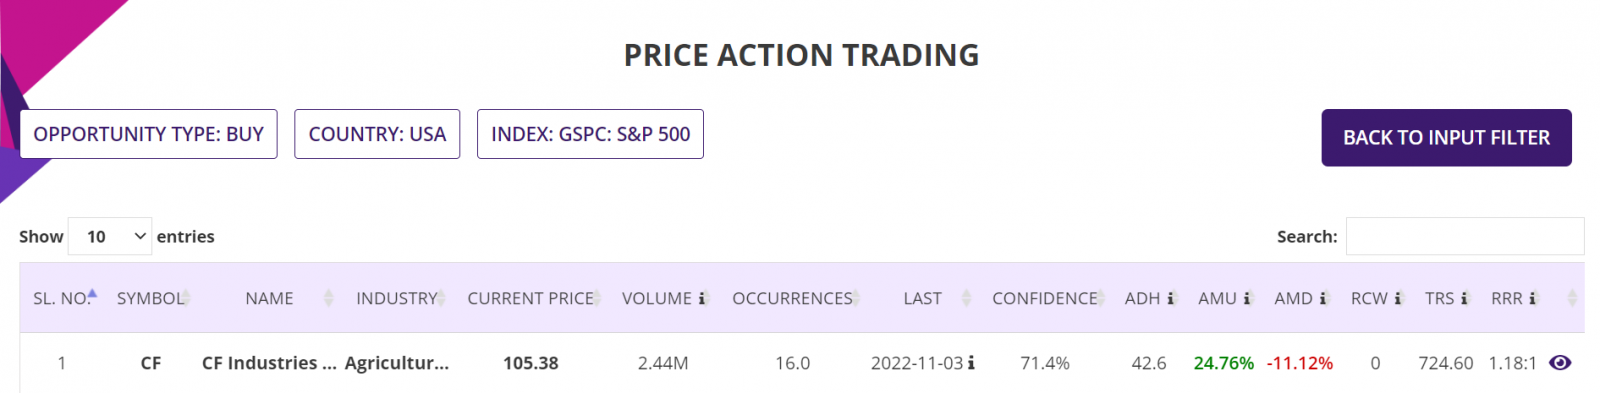
BULLISH, Price Action study since 2020 reveal 71.4% probability of success with historical worst-case RRR of over 1.18:1 in all completed BUY (LONG) trade.
Most Recent Event: Most recent Price Action event was on Thursday, the 3rd November. Preferred trade opening is the next market open day on Friday, the 4th November or Monday, the 7th November.
Overview:
CF Industries Holdings, Inc. manufactures and sells hydrogen and nitrogen products for energy, fertilizer, emissions abatement, and other industrial activities worldwide. The company was founded in 1946 and is headquartered in Deerfield, Illinois.
Its principal products include anhydrous ammonia, granular urea, urea ammonium nitrate, and ammonium nitrate products. The company also offers diesel exhaust fluid, urea liquor, nitric acid, and aqua ammonia products; and compound fertilizer products with nitrogen, phosphorus, and potassium. It primarily serves cooperatives, independent fertilizer distributors, traders, wholesalers, and industrial users.
(Courtesy: Yahoo Finance)
Sector and Industry Details:
Sector(s): Basic Materials
Industry: Agricultural Inputs
Full Time Employees: 2,970
(Courtesy: Yahoo Finance)
Fundamentals:
52 Week Range 57.25 - 119.60
Avg. Volume 2,587,087
Market Cap 20.998B
PE Ratio (TTM) 8.64
EPS (TTM) 12.19
Ex-Dividend Date Nov 14, 2022
1y Target Est 116.26
(Courtesy: Yahoo Finance)
Current trading price:
As of Thursday, the 3rd November 2022, or the day the Price Action event took place, the stock closed at 105.24. The last closing price on Friday, the 4th November was 105.38.
PRICE ACTION:
The Stock was Bullish 71.4% of the time following Bullish Price action events since the beginning of 2020. Here is the key Price Action event performance of the Stock:
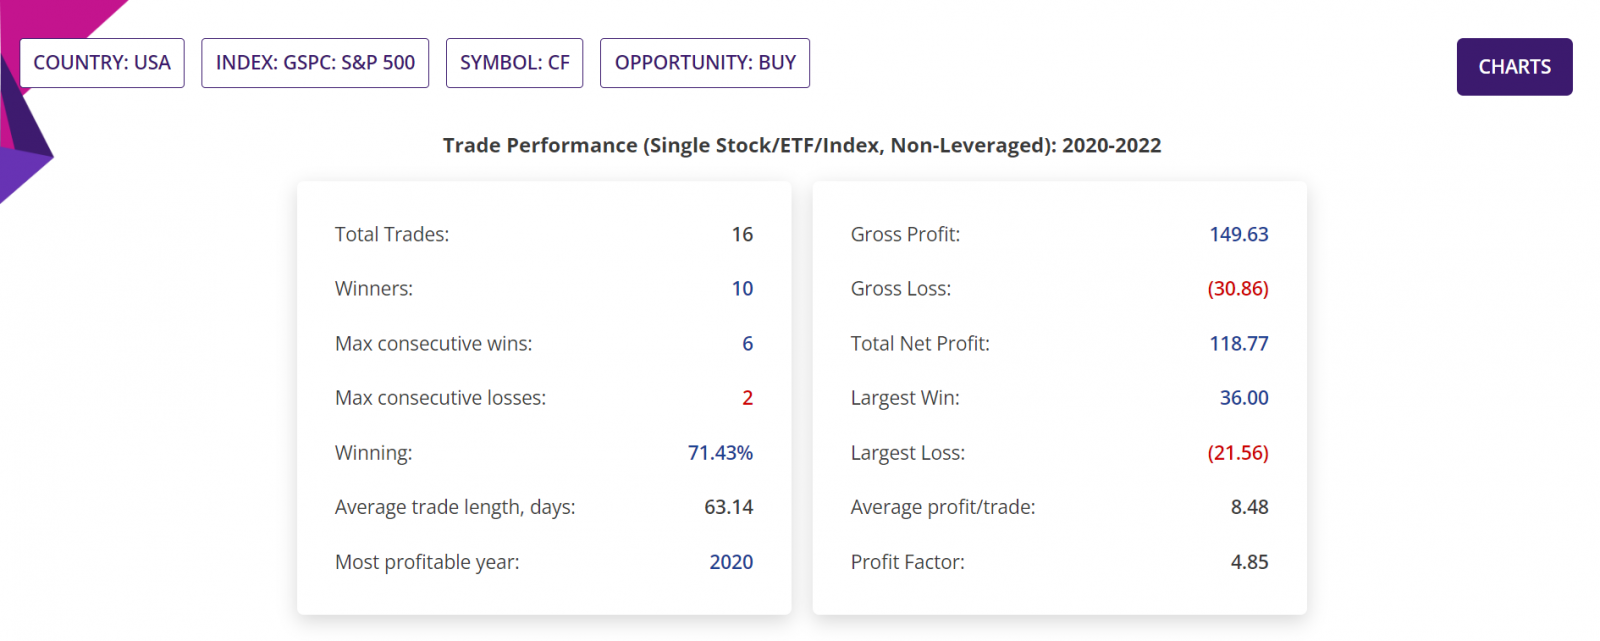
Summary report: Since beginning of 2020, there were 16 BULLISH Price action events, of which one event is yet to be traded, that is the current Bullish trading opportunity being discussed in this blogpost and one event triggering trade is still open. These leaves 14 completed trades, of which 10 were winners (and hence 71.4% confidence or Probability) with average move up (AMU) of 24.76% and average move down (AMD) of 11.12% for an average holding time (ADH) of about 43 days.
AMD of 11.12% is not quite an opportunity that you would like to trade as it means a significant possible drawdown during the trade holding period. Many traders feel very uncomfortable to large drawdowns. So, this opportunity would be classified as Observation only.
Historical RRR in those completed trades was 1.18:1. Please note that RRR shown here is a worst-case scenario, as many trades could be closed sooner with higher profit compared to trades closed at the end of 9-week period.
Detailed Report, Trade Performance: If 100 stocks were bought following those BULLISH Price action events, then a trader would have had a Gross Profit of $14,963, Gross Loss of $3,086, making a Total Net Profit of $11,877. In those closed trades, the Largest Win was $3,600, Largest Loss is $2,156, the Average profit/trade being $848. All figures above are in USD.
The Profit Factor (which is quotient of Gross Profit and Gross Loss) in those trades was 4.85.
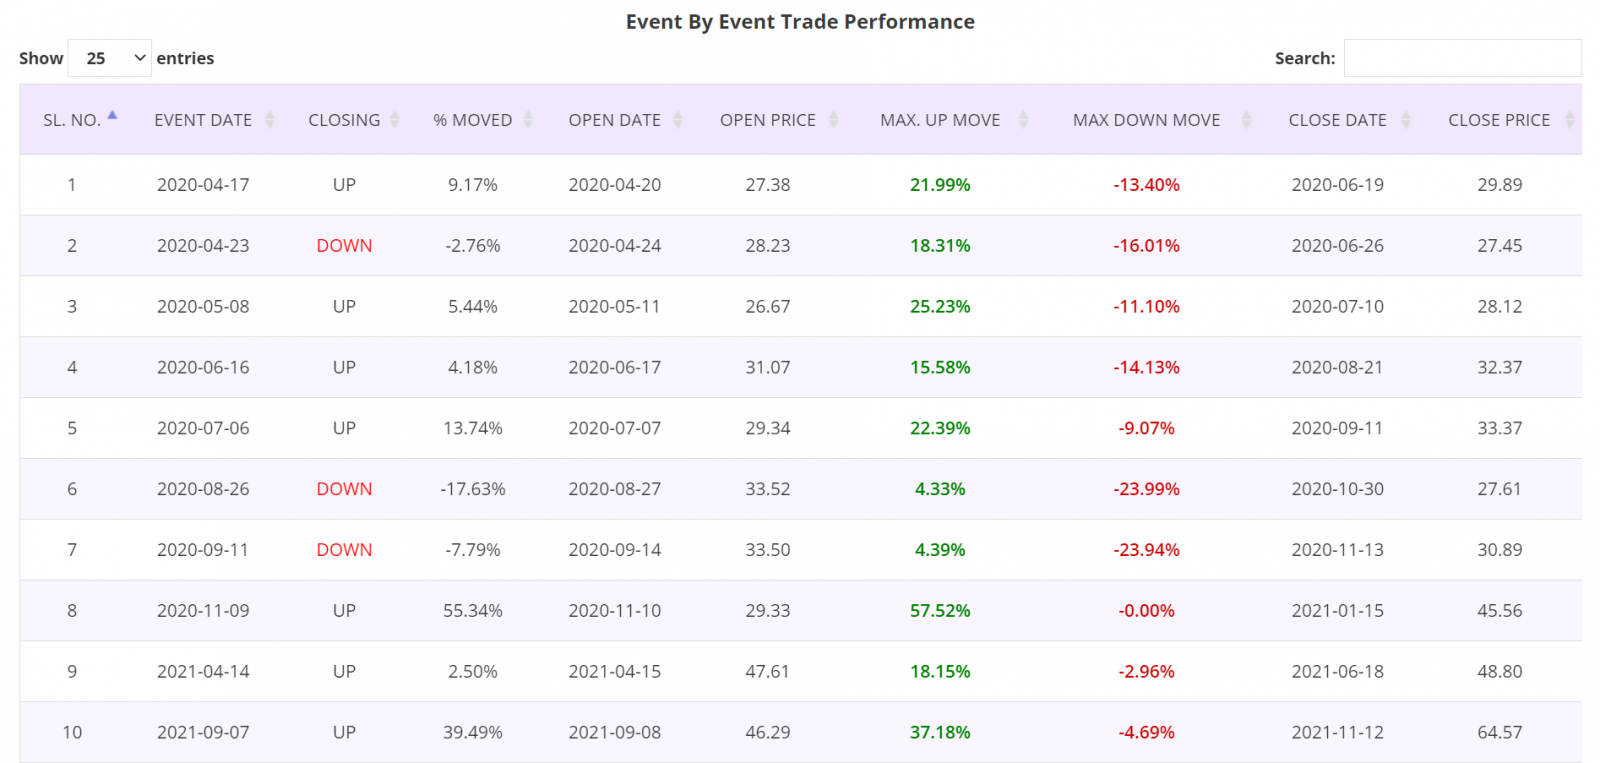
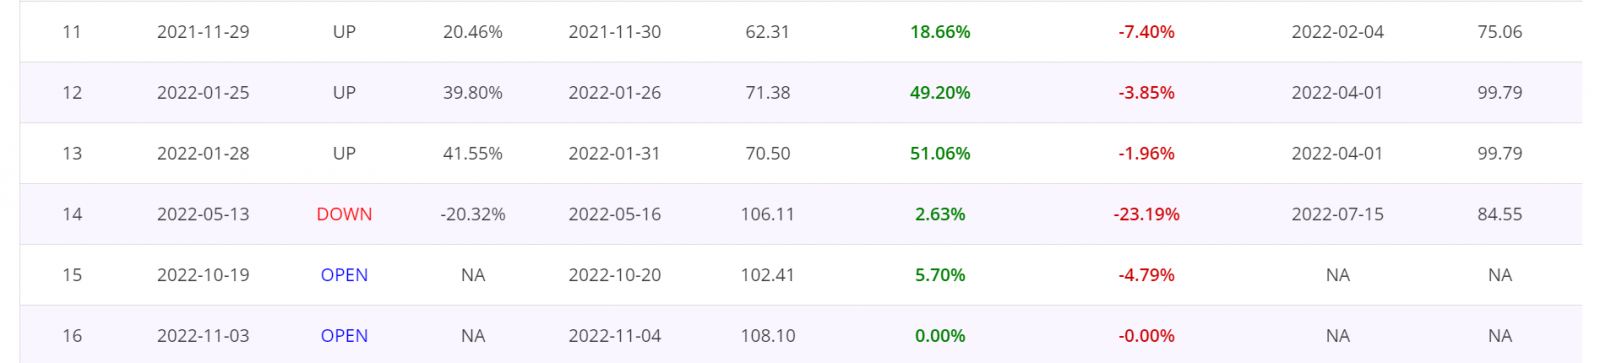
Detailed Report, Event by Event Trade Performance: Results of each trade taken following the Price Action events since the beginning of 2020 are as shown in the table below. As can been seen in the table, 10 trades were winners and 4 losers. These tables are from the Detailed report of the Price Action trading app.
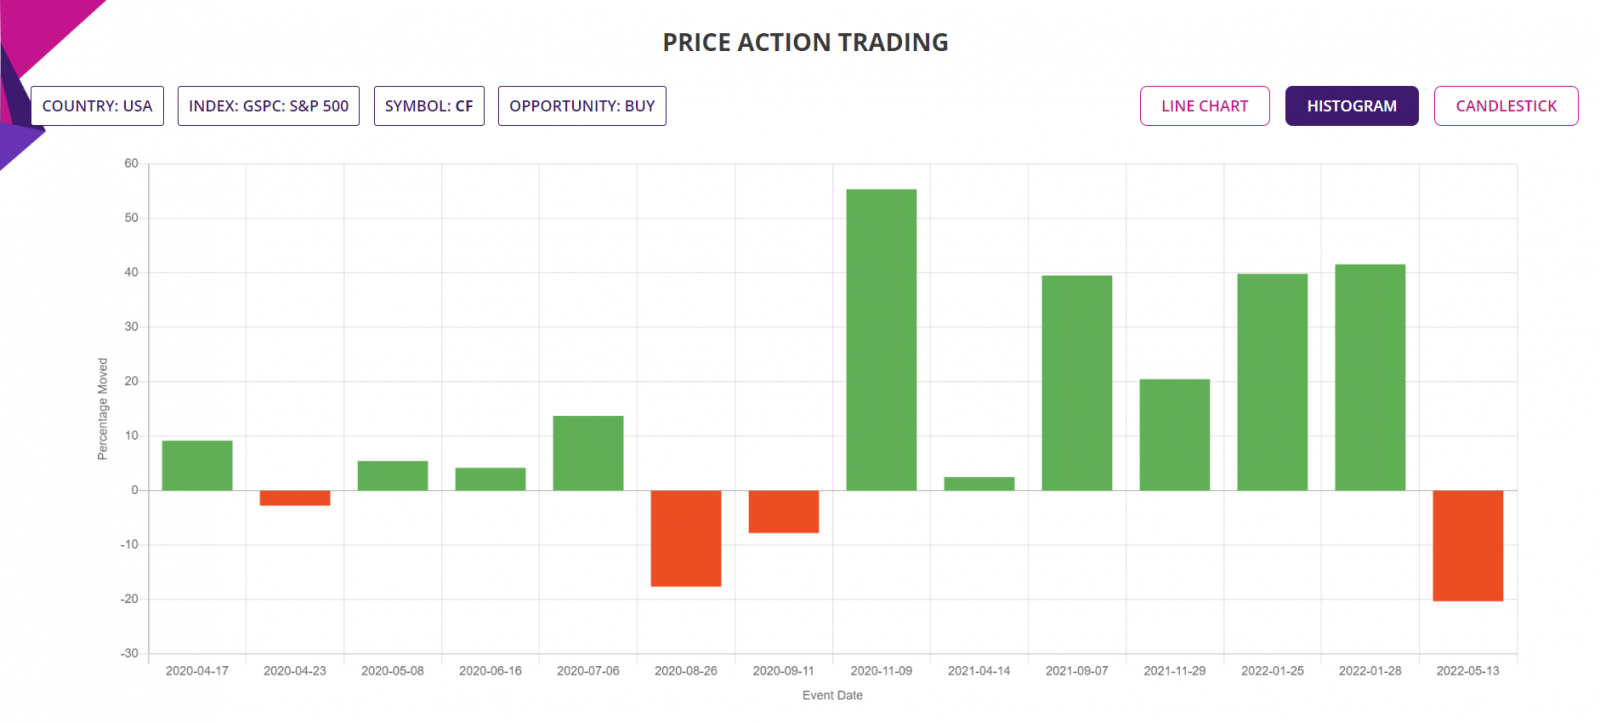
Histogram Chart: The chart below shows the percentage moves of the underlying Stock of Interest following each Price Action event for the period of analysis mentioned earlier, for a quick visual clue of the trade-by-trade performance.
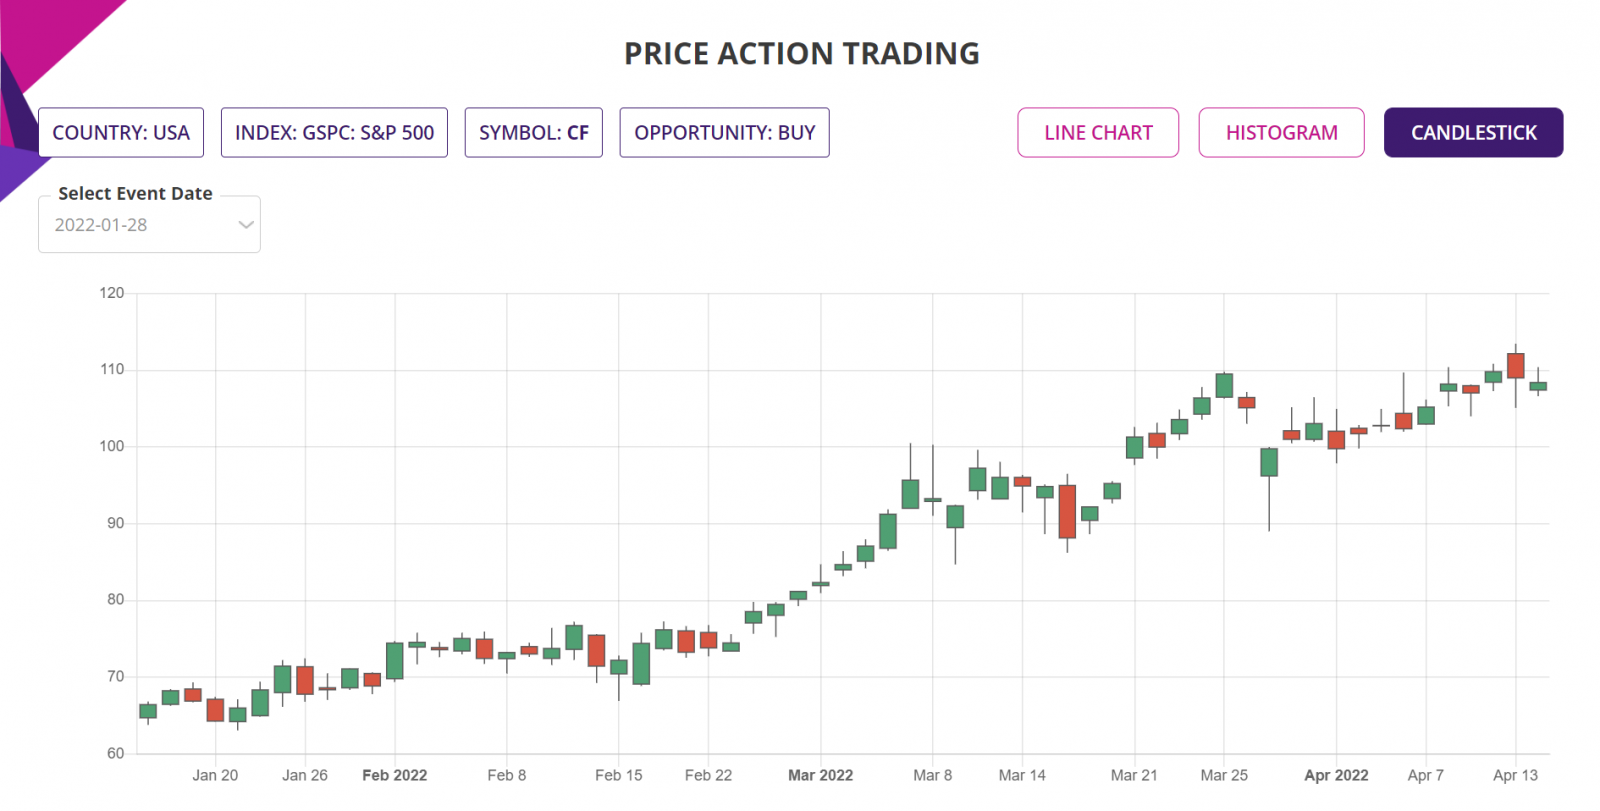
Candlestick Chart: The candlestick chart of the underlying Stock/ETF’s latest performance is as shown below. In the web-based Price Action trading app, the chart is available for all the price action events since the year in the “Data since” in the input filter page.
Trade Structure:
Since, this opportunity is a observation only, we are not providing any trade structure. USA has very liquid Options market, so some traders might like to use this opportunity to create a debit spread options position with one or couple of contracts to strictly manage their risk and reward.
Further Information about trading applications:
Please visit the following URL for more information on various trading applications from Sapphire Capitals which are designed to deliver high probability trading opportunities for swing trading as well as for intraday trading:
https://www.sapphirecapitals.com/pages/swing-trading-stock-seasonality-strategy/
https://www.sapphirecapitals.com/pages/swing-trading-stock-price-action-strategy/
https://www.sapphirecapitals.com/pages/swing-trading-volume-spike-stock-trading-strategy/
https://www.sapphirecapitals.com/pages/day-trading-intraday-seasonality-trading/
Disclaimer:
Sapphire Private Assets (ABN: 34 613 892 023, trading as Sapphire Capitals) is not a broker or a financial adviser but an education and research organisation; we provide training and tools for traders and DIY fund managers for trading in global financial markets. The contents of the blog have been produced by using technical analysis and trading applications developed by Sapphire Capitals for the Stock and ETF traded worldwide. The contents of this blog are intended for education and research purposes only and is not a recommendation or solicitation to invest in any Stock or ETF.
For more details, please visit www.sapphirecapitals.com/Disclaimer.


