
-
 Admin123 :
Info - Sapphire Capitals
Admin123 :
Info - Sapphire Capitals -
 Date :
2022-10-29
Date :
2022-10-29
Stock In Focus - Week 44 (2022) – INDIA – SEASONALITY TRADING STRATEGY
The week beginning Monday, the 31st October is Week 44 as per ISO numbering convention of the weeks of a year.
Country in focus:
This week we look at the Stocks from INDIA in NIFTY 500 index.
Stock/ETF in focus:
Specific Stock in focus Biocon Limited (Ticker: BIOCON). The Stock is listed in the National Stock Exchange (NSE), trading currency being Indian Rupees or INR.
Trade Direction:
BULLISH, Seasonality study for last 10 years reveal 90.0% probability of success in a BUY (LONG) trade for this week and 80% probability for the trade next week (Week 45). Please see the Summary report screenshot later in the blog.
Overview:
Biocon Limited, a biopharmaceutical company, manufactures pharmaceuticals, and medicinal chemical and botanical products. Biocon Limited was founded in 1978 and is headquartered in Bengaluru, India.
The company operates through Generics, Novel Biologics, Biosimilars, and Research Services segments. It focuses in the areas of diabetes, oncology, immunology, ophthalmology, and bone health diseases. In addition, It is involved in the integrated discovery, development, and manufacturing services for small and large molecules. The company serves customers in approximately 120 countries.
(Courtesy: Yahoo Finance)
Sector and Industry Details:
Sector(s): Healthcare
Industry: Biotechnology
Full-time employees: 15,000
(Courtesy: Yahoo Finance)
Fundamentals:
52-week range 258.25 - 410.70
Avg. volume 1,915,484
Market cap 327.284B
Beta (5Y monthly) 0.58
PE ratio (TTM) 45.74
EPS (TTM) 5.96
Earnings date 14 Nov 2022
Ex-dividend date 30 June 2022
(Courtesy: Yahoo Finance)
Current trading price:
As of Friday, close of 28st October 2022, the stock was trading at 272.60. All prices are in INR.
SEASONALITY:
The stock demonstrated very strong SEASONAL move in week 44 of the year, here are some of the details of its SEASONAL behaviour.
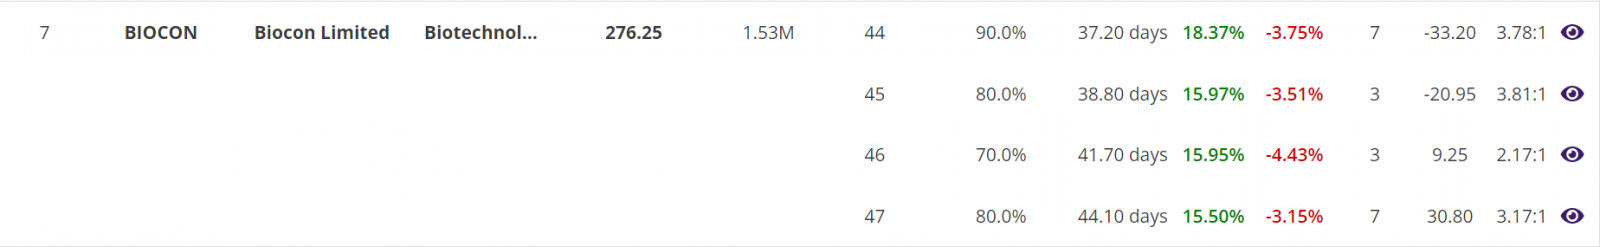
Summary report: In 9 out of last 10 years in week 44, the stock was BULLISH with average move up (AMU) of 18.37% and average move down (AMD) of 3.75% for an average holding time (ADH) of 37 days. The worst-case average Reward-Risk Ratio (RRR) for all 10 trades over last 10 years was 3.78:1. See the summary report table below:

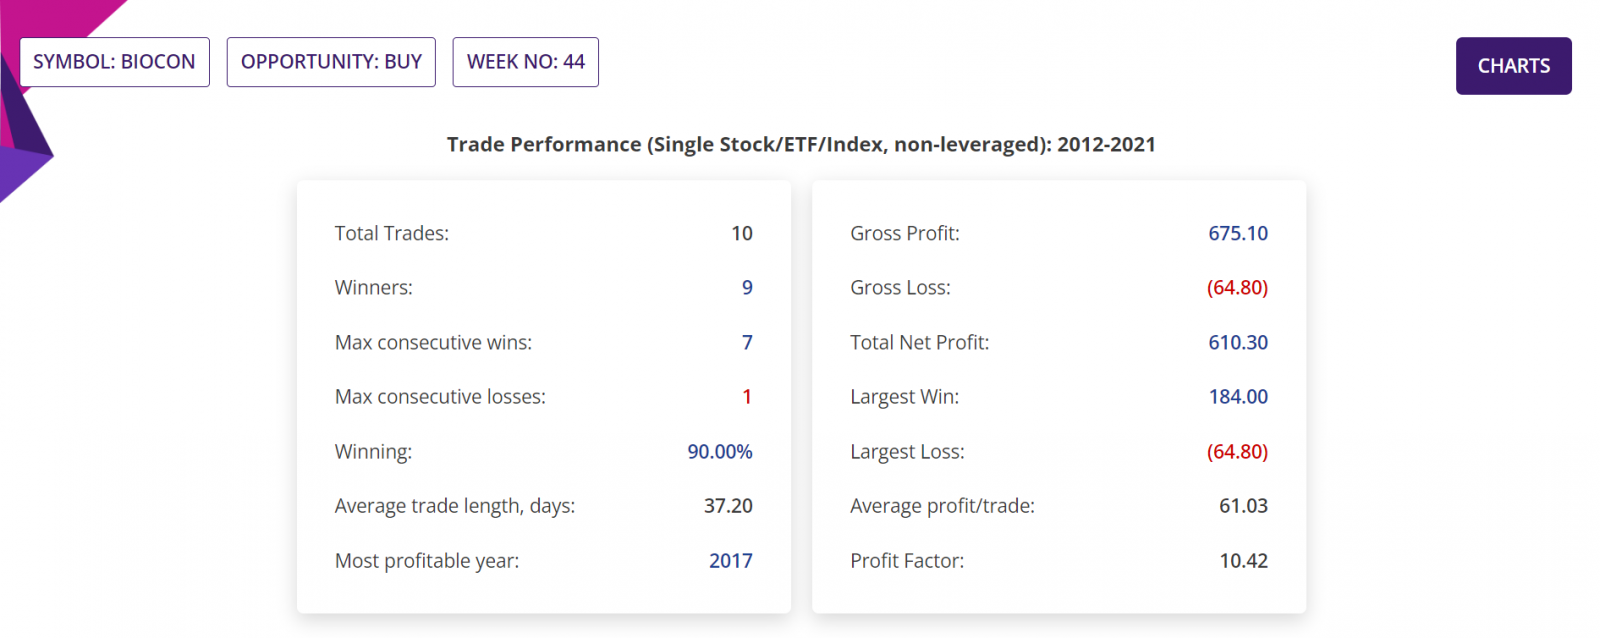
Detailed Report, Trade Performance: If 100 stocks were bought in the beginning of week 44 every year for last 10 years, then a trader would have had a Gross Profit of INR67,510, Gross Loss of INR6,480, making a Total Net Profit of INR61,030.
In those 10 years, the Largest Win was INR18,400, Largest Loss is INR6,480, the Average profit/trade being INR6,103. Profit factor (quotient of Gross Profit and Gross Loss) being 10.42. All figures excluding trading commissions. Please see the section of the detailed report below.
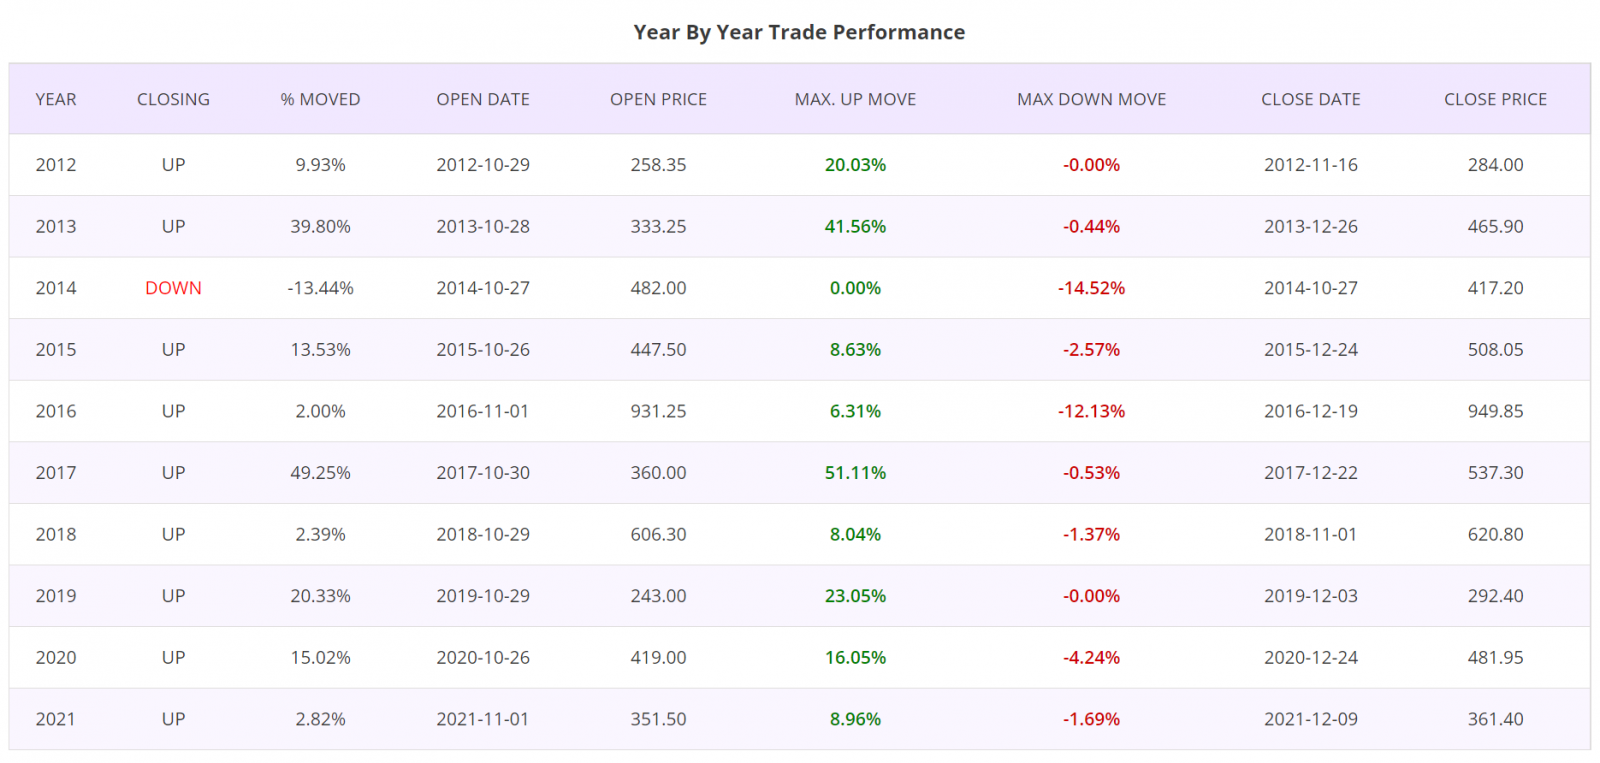
Detailed Report, Year by Year Trade Performance: Trades taken at the beginning of Week 44 for all years of last 10 years was winners, except for the year 2014. Please see the section of the detailed report below.
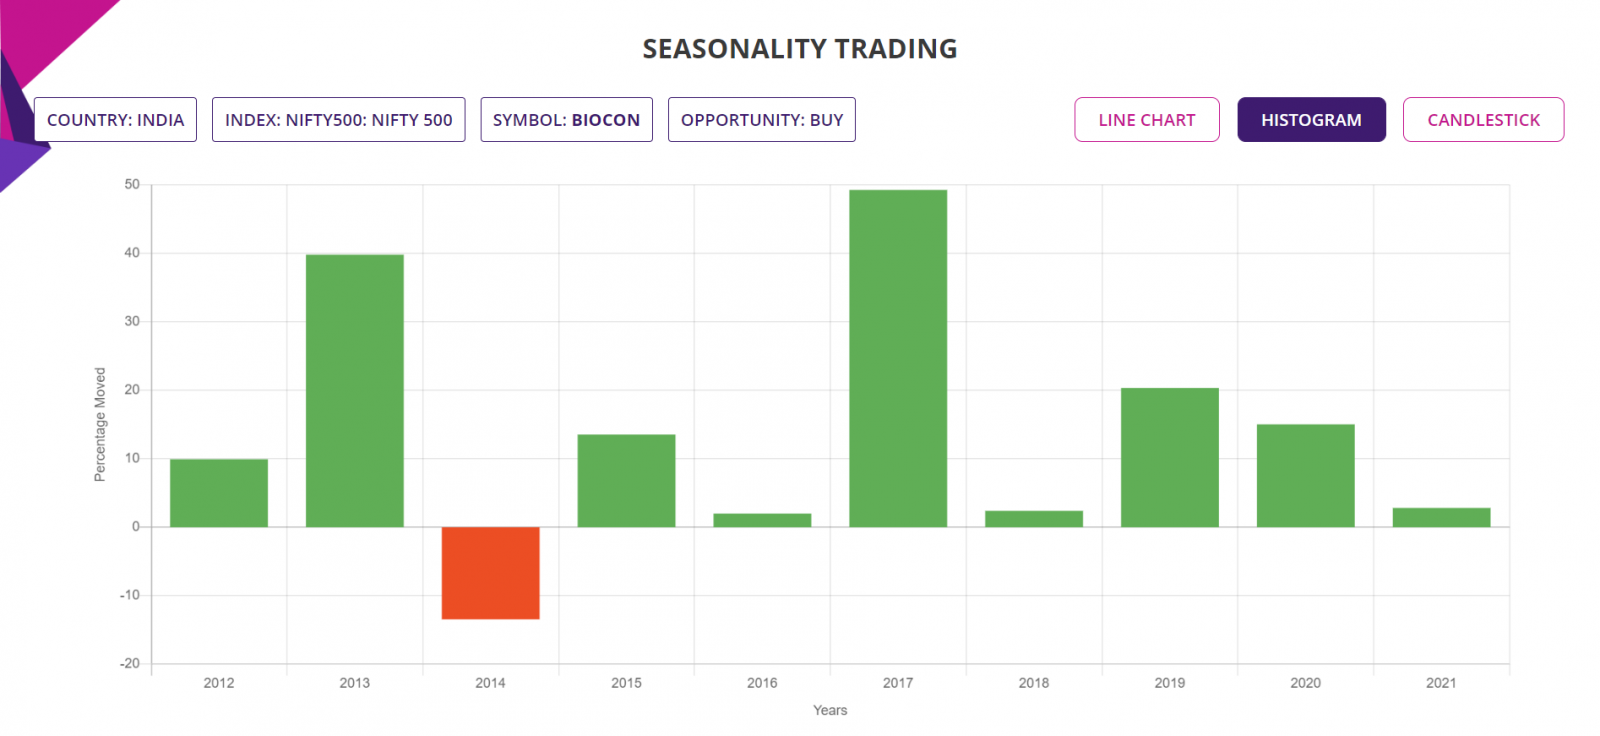
Histogram Chart: The chart below shows the percentage moves of the underlying Stock of Interest in each of the years in the Seasonality analysis, for a quick visual clue of the year-by-year trade performance.
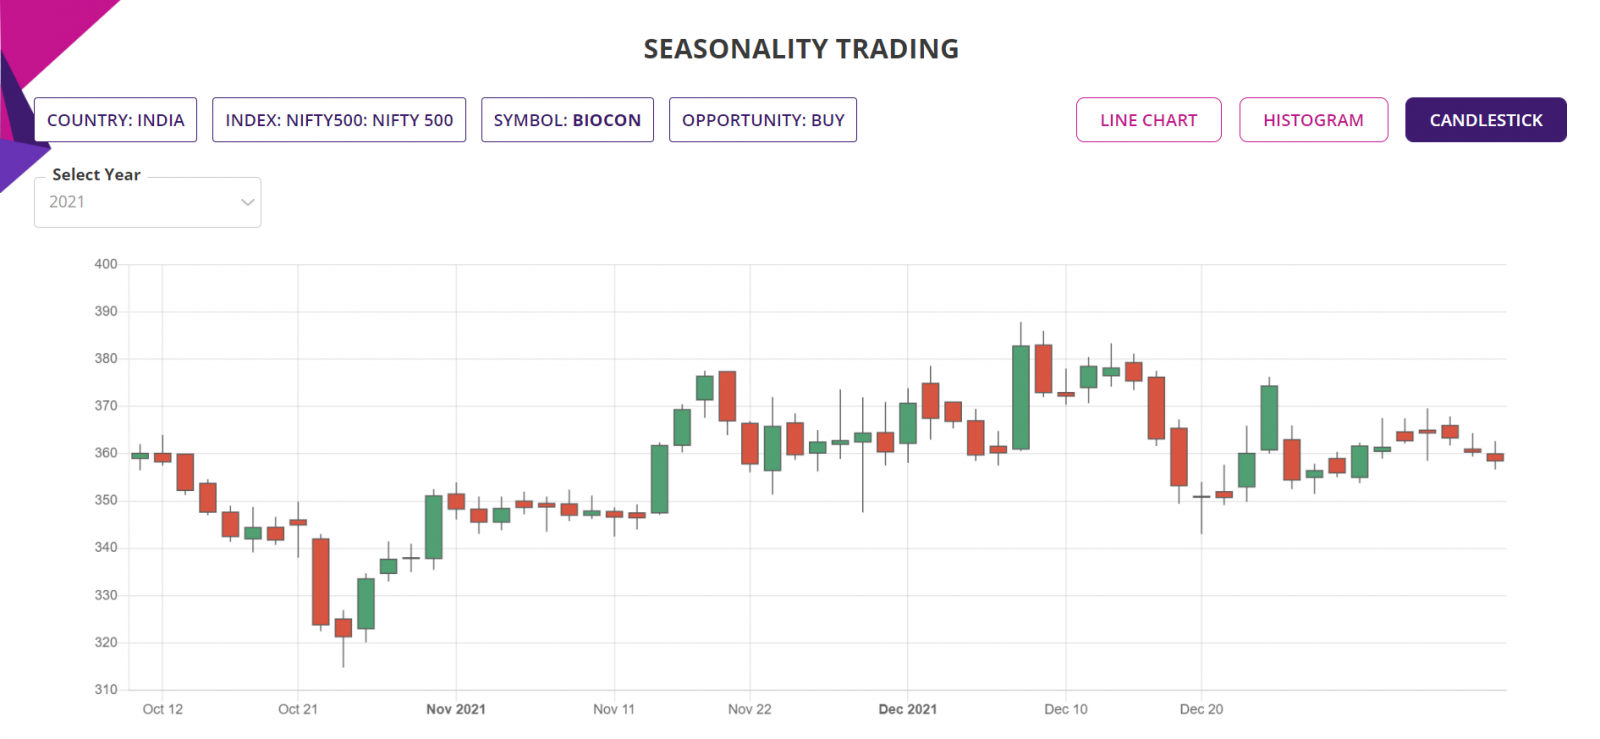
Candlestick Chart: The candlestick chart of the underlying Stock/ETF’s latest performance is as shown below. In the web-based Seasonality trading application, the chart is available for all the years of the Seasonality analysis.
Trade Structure:
If we had traded the Stock this week, then we would have structured the trade as follows:
|
TRADE STRUCTURE (All prices in Indian Rupees or INR) |
||
|
Stock price |
272.60 |
Assuming trade placed at last traded price |
|
Stocks |
100 |
Number of Stocks used for this trade |
|
Investment required |
27,260 |
Amount of fund required for the trade |
|
|
|
|
|
Target Stock price (TP) |
316.22 |
16% above the current price |
|
Stop Stock price (SL) |
261.70 |
4% below the current price |
|
|
|
|
|
Profit Target |
4,362 |
Limit order placed at underlying TP price |
|
Stop Loss |
1,090 |
Guaranteed stop at SL price |
The choice of RRR of 4:1 is in line with the worst-case average RRR from the last 10 trades in each of the last 10 years in Week 44, since 2012 till 2021.
Further Information about trading applications:
Please visit the following URL for more information on various trading applications from Sapphire Capitals which are designed to deliver high probability trading opportunities for swing trading as well as for intraday trading:
https://www.sapphirecapitals.com/pages/swing-trading-stock-seasonality-strategy/
https://www.sapphirecapitals.com/pages/swing-trading-stock-price-action-strategy/
https://www.sapphirecapitals.com/pages/swing-trading-volume-spike-stock-trading-strategy/
https://www.sapphirecapitals.com/pages/day-trading-intraday-seasonality-trading/
Disclaimer:
Sapphire Private Assets (ABN: 34 613 892 023, trading as Sapphire Capitals) is not a broker or a financial adviser but an education and research organisation; we provide training and tools for traders and DIY fund managers for trading in global financial markets. The contents of the blog have been produced by using technical analysis and trading applications developed by Sapphire Capitals for the Stock and ETF traded worldwide. The contents of this blog are intended for education and research purposes only and is not a recommendation or solicitation to invest in any Stock or ETF.
For more details, please visit www.sapphirecapitals.com/Disclaimer.


