
-
 Admin123 :
Admin - Sapphire Capitals
Admin123 :
Admin - Sapphire Capitals -
 Date :
2022-10-03
Date :
2022-10-03
Stock of interest - Week 40 (2022) – INDIA – PRICE ACTION TRADING STRATEGY
The week beginning Monday, the 3rd October is Week 40 as per ISO numbering convention of the weeks of a year. This is also a festive week in many parts of India. Navaratri (Nine nights in English) started last week and continues till this week as Indians worships the Goddess Durga.
Country in focus:
This week we look at the Stocks from INDIA in NIFTY 500 index.
Stock/ETF in focus:
Specific Stock in focus is RHI Magnesita India Limited (Ticker: RHIM). The trading currency is Indian Rupees or INR.
Trade Direction:
BULLISH, Price Action study since 2020 reveal 90% probability of success with RRR of over 2.64:1 in a BUY (LONG) trade.
Most Recent Event: Most recent Price Action event was on Thursday, the 29th September. Preferred trade opening is the next market open day on Friday, the 30th September or Monday, the 3rd October.
Overview:
RHI Magnesita India Limited manufactures and trades in refractories, monolithics, bricks, and ceramic paper for the steel industry primarily in India. The company was incorporated in 2010 and is based in Gurugram, India. RHI Magnesita India Limited is a subsidiary of Veitscher Vertriebsgesellschaft m.b.H.
It offers isostatically pressed continuous casting refractories; slide gate plates; nozzles and well blocks; tundish nozzles; and bottom purging refractories and top purging lances, slag arresting darts, castables, and alumina and magnesia carbon bricks, as well as spray mass for tundish working linings. The company also provides rendering management services. It serves steel, cement, nonferrous metals, glass, environment and energy, foundry, and paper and pulp industries. The company was formerly known as Orient Refractories Limited and changed its name to RHI Magnesita India Limited in July 2021.
(Courtesy: Yahoo Finance)
Sector and Industry Details:
Sector(s): Industrials
Industry: Metal Fabrication
Full-time employees: 2,000
(Courtesy: Yahoo Finance)
Fundamentals:
52-week range 323.30 - 701.15
Avg. volume 263,899
Market cap 108.383B
Beta (5Y monthly) 0.99
PE ratio (TTM) 35.95
EPS (TTM) 18.72
Forward dividend & yield 2.50 (0.37%)
Ex-dividend date 14 Sept 2022
(Courtesy: Yahoo Finance)
Current trading price:
As of Thursday, the 29th September 2022, or the day the Price Action event took place, the stock was trading at 650.90. The last closing price on Friday, the 30th September was 669.95.
PRICE ACTION:
The Stock was bullish 90% of the time following Price action events since the beginning of 2020. Here is the key Price Action event performance of the Stock:
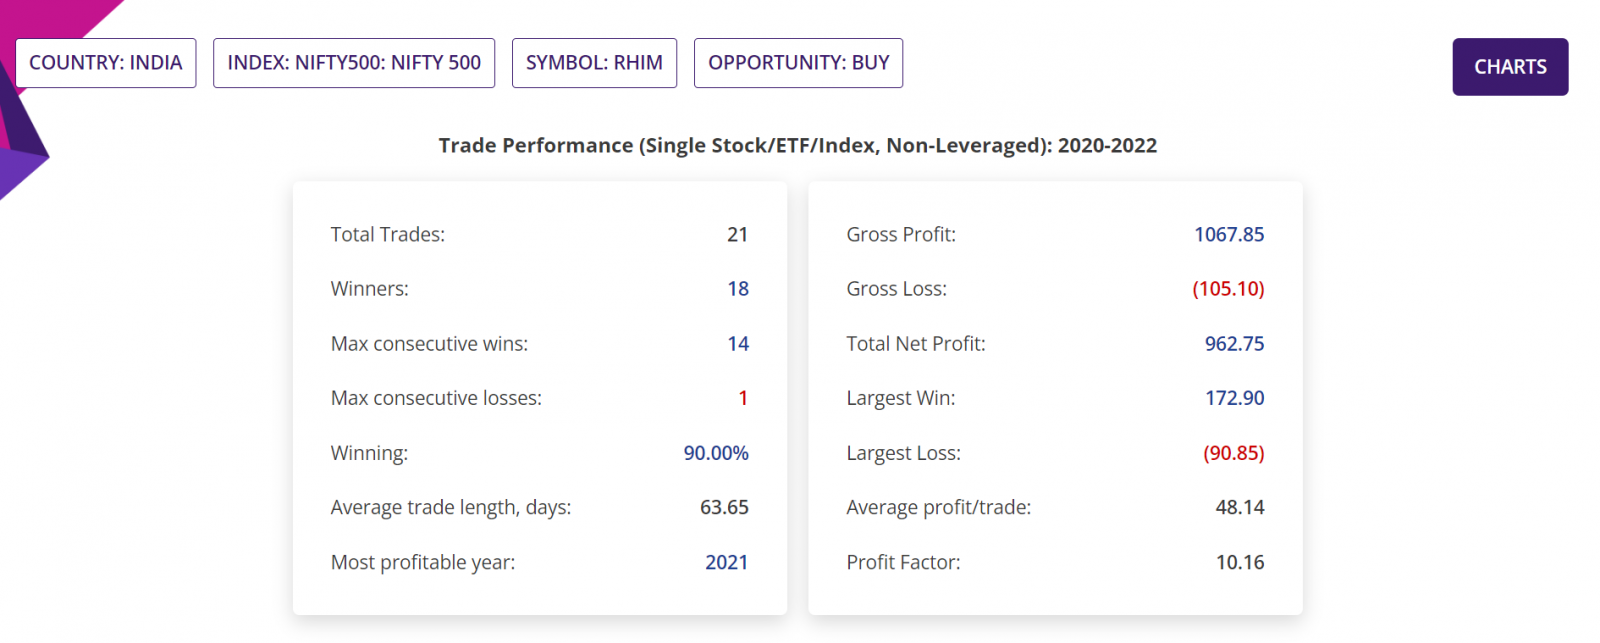
Summary report: Since beginning of 2020, there were 21 BULLISH Price action events, of which one event is still in open trade. These leaves 20 completed trades, of which 18 were winners with average move up (AMU) of 22.17% and average move down (AMD) of 5.38% for an average holding time (ADH) of about 40 days. One latest BULLISH Price Action event is the trading opportunity discussed in this blogpost;
Historical RRR in those completed trades was a staggering 2.64:1. Please note that RRR shown here is a worst-case scenario, as many trades could be closed sooner with higher profit compared to trades closed at the end of 9-week period.

Detailed Report, Trade Performance: If 100 stocks were bought following those BULLISH Price action events, then a trader would have had a Gross Profit of 1,06,785, Gross Loss of 10,510, making a Total Net Profit of 96,275;
In those closed trades, the Largest Win was 17,290, Largest Loss is 9,085, the Average profit/trade being 4,814. The Profit Factor (which is quotient of Gross Profit and Gross Loss) in those trades was 10.16.
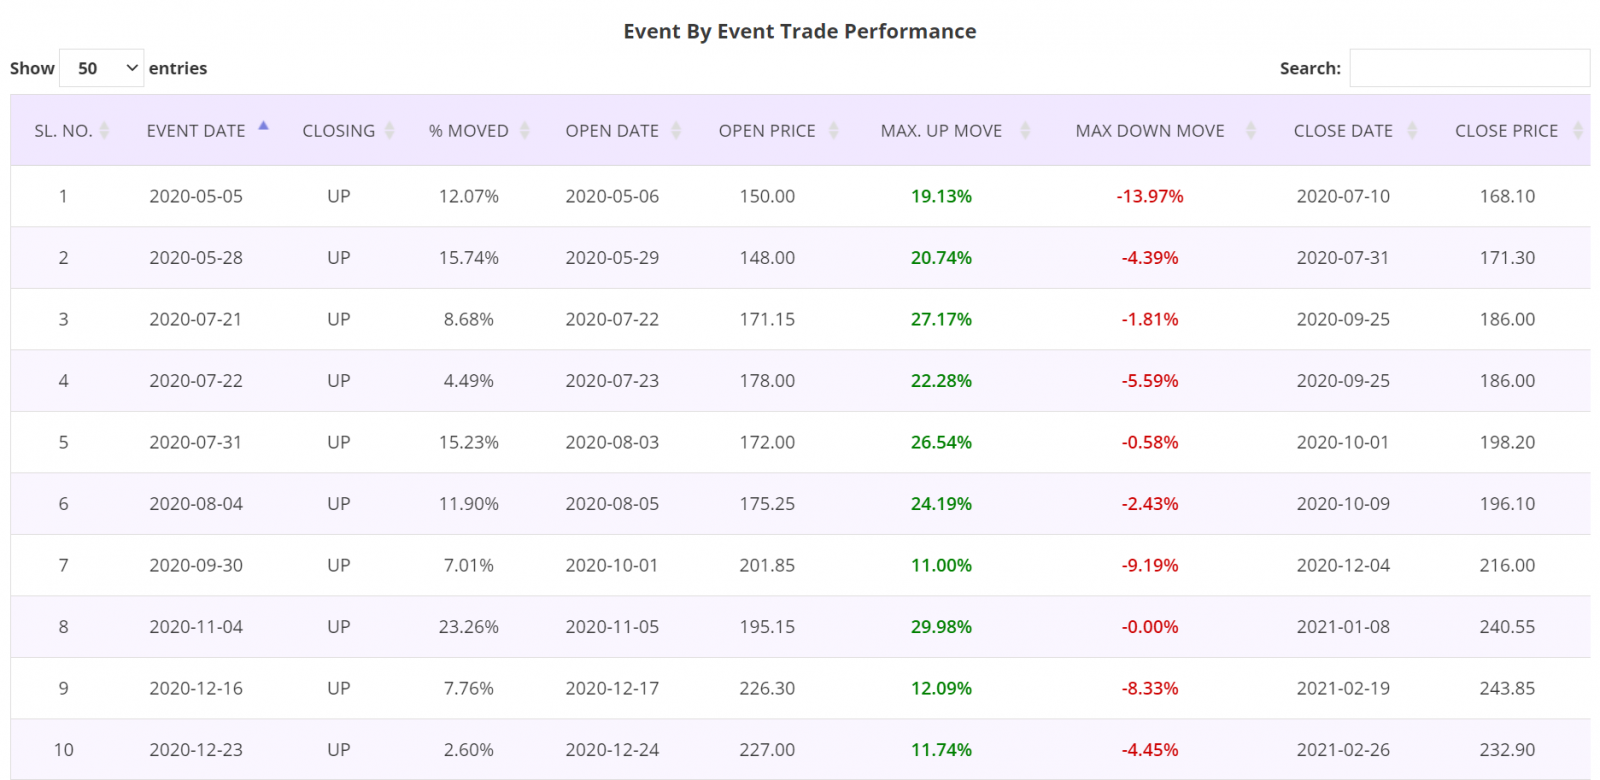
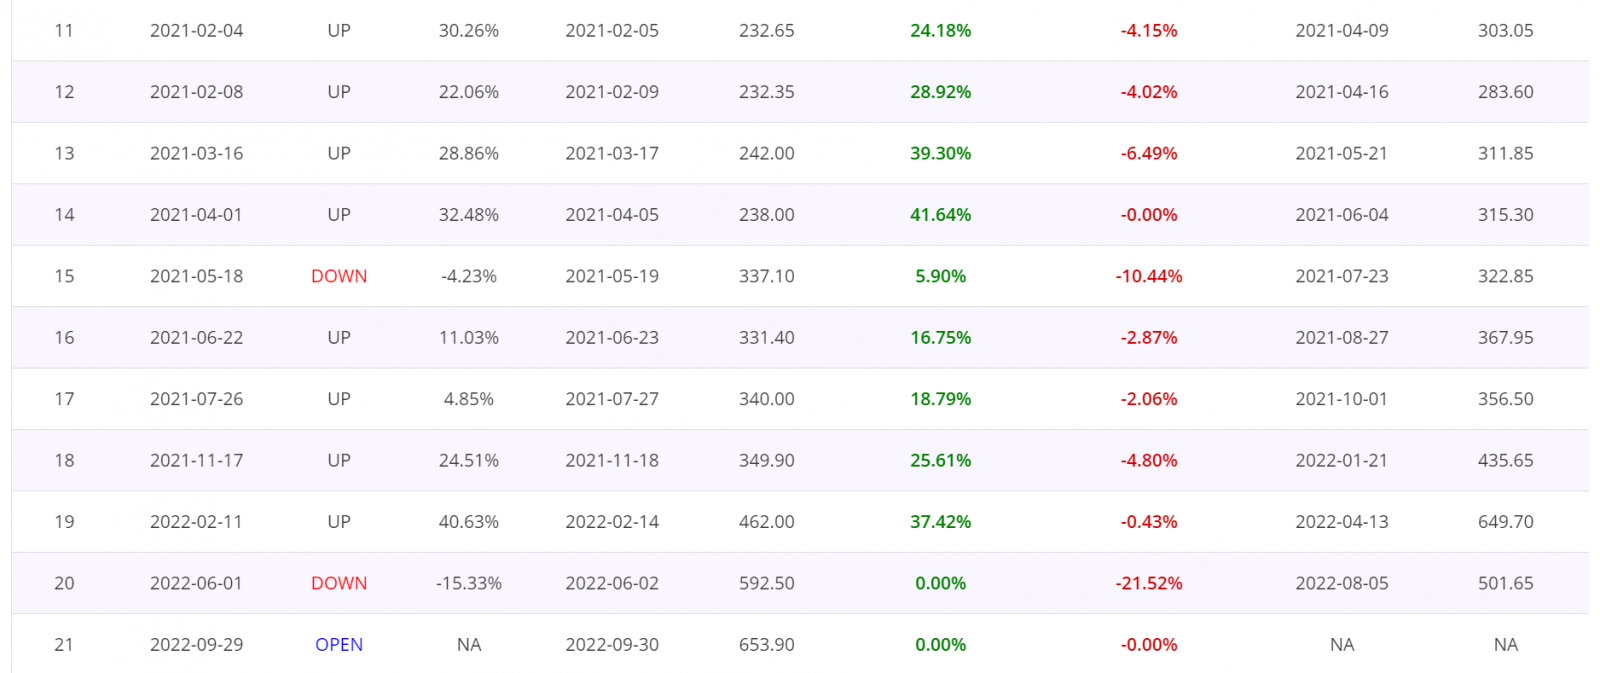
Detailed Report, Trade by Trade Performance: Results of each trade taken following the Price Action events since the beginning of 2020 are as shown in the table below. As can been seen in the table, 18 trades were winners and two losers. These tables are from the Detailed report of the Price Action trading app.
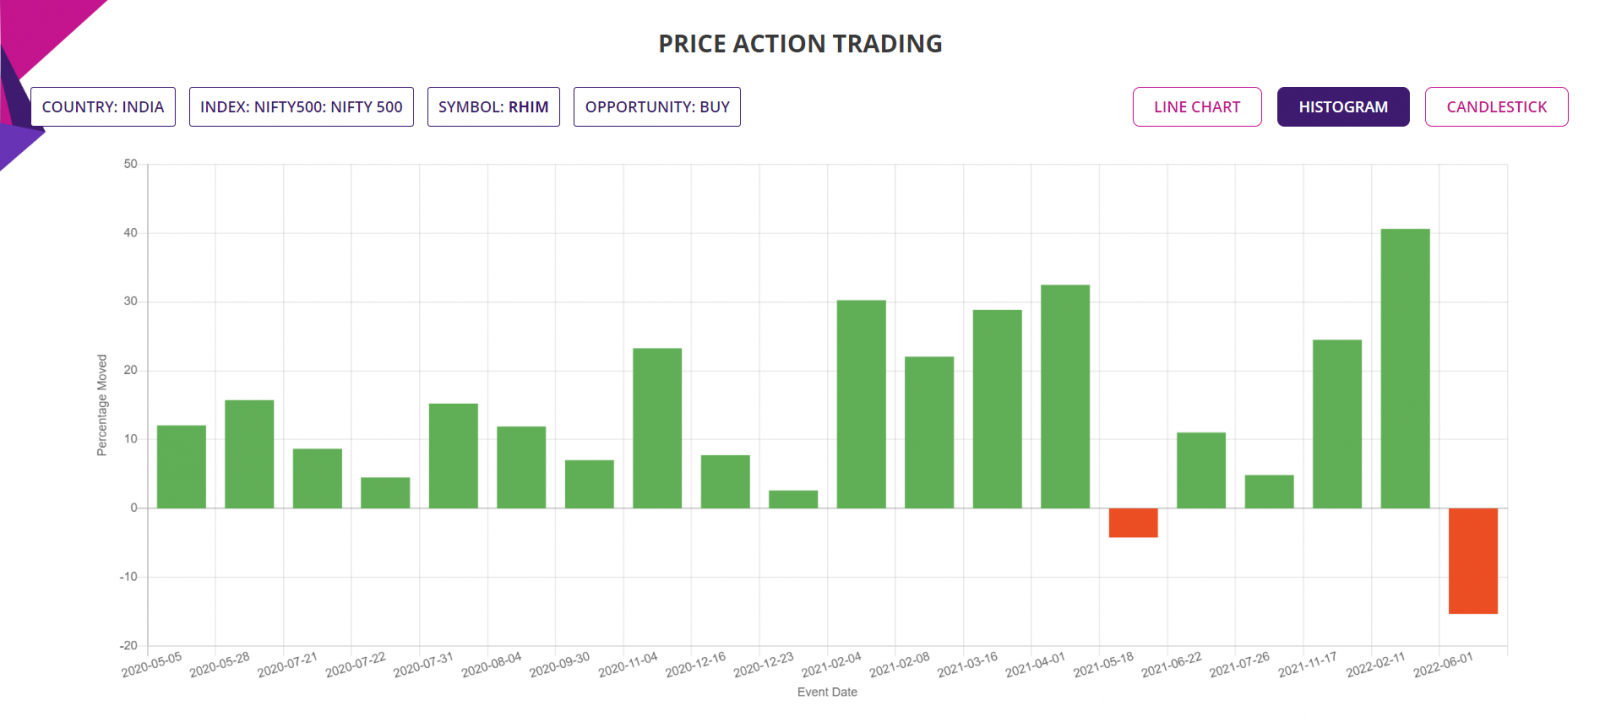
Histogram Chart: The chart below shows the percentage moves of the underlying Stock of Interest following each Price Action event for the period of analysis mentioned earlier, for a quick visual clue of the trade-by-trade performance.
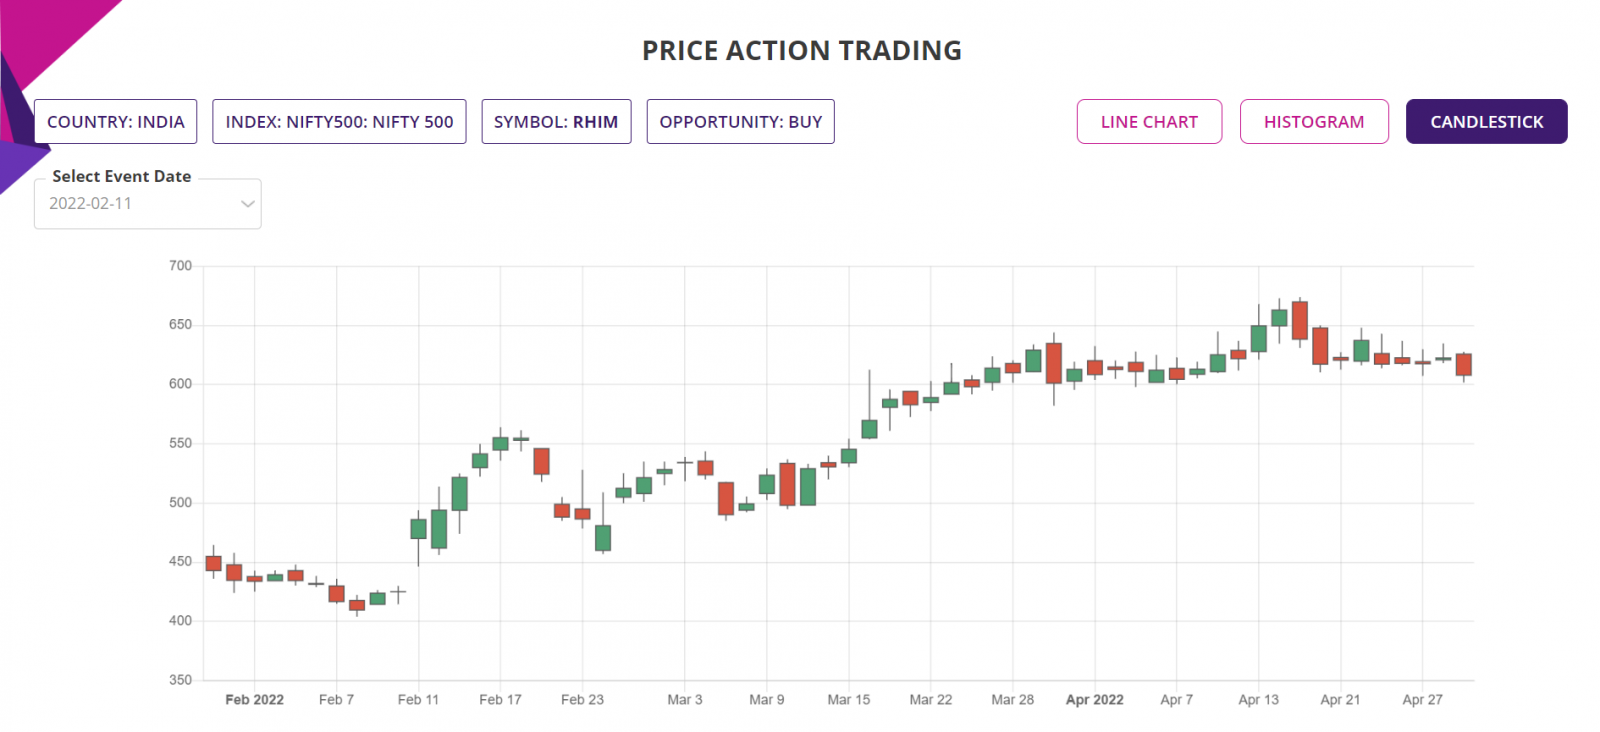
Candlestick Chart: The candlestick chart of the underlying Stock/ETF’s latest performance is as shown below. In the web-based Price Action trading app, the chart is available for all the price action events since the year in the “Data since” in the input filter page.
Trade Structure:
This week, for this trading opportunity, you could trade in many different ways, depending upon which country where you are located. Please check with your broker for availability. Here are some ideas:
- Stock: If you are in a country where no derivative trading is allowed, you could trade the opportunity as simple Stock BUY and SELL, with predefined TP and SL;
- CFD: If you live in Australia or some of the European countries where CFD trading is allowed, you could trade at 10:1 or 20:1 margin, thus dramatically increasing the RoI, but with same SL and TP as regular Stock trade. But please be fully aware of the risks associated with CFD trading, the guaranteed stop requirements and interest on margin to be paid daily, for each day the trade is held;
- Options: India has reasonably liquid Options market but this Stock is not so heavily traded. As such, traders in India may not be able to take advantage of Options to trade this opportunity. Usually, in a heavily traded Options market, Debit spread or Credit spread would let traders be in full control of the RRR of the trade. Details of such trading strategies are available in our Trading Proficiency Training Program Level 1, to be available soon.
Further Information about trading applications:
Please visit the following URL for more information on various trading applications from Sapphire Capitals which are designed to deliver high probability trading opportunities for swing trading as well as for intraday trading:
https://www.sapphirecapitals.com/pages/swing-trading-stock-seasonality-strategy/
https://www.sapphirecapitals.com/pages/swing-trading-stock-price-action-strategy/
https://www.sapphirecapitals.com/pages/swing-trading-volume-spike-stock-trading-strategy/
https://www.sapphirecapitals.com/pages/day-trading-intraday-seasonality-trading/
Disclaimer:
Sapphire Private Assets (ABN: 34 613 892 023, trading as Sapphire Capitals) is not a broker or a financial adviser but an education and research organisation; we provide training and tools for traders and DIY fund managers for trading in global financial markets. The contents of the blog have been produced by using technical analysis and trading applications developed by Sapphire Capitals for the Stock and ETF traded worldwide. The contents of this blog are intended for education and research purposes only and is not a recommendation or solicitation to invest in any Stock or ETF.
For more details, please visit www.sapphirecapitals.com/Disclaimer.


