
-
 Admin123 :
Admin - Sapphire Capitals
Admin123 :
Admin - Sapphire Capitals -
 Date :
2022-09-25
Date :
2022-09-25
Stock In Focus - Week 39 (2022) – BELGIUM – SEASONALITY TRADING STRATEGY
The week beginning Monday, the 26th September is Week 39 as per ISO numbering convention of the weeks of a year.
Country in focus:
This week we look at the Stocks from Belgium in BFX: BEL-20 index.
Stock/ETF in focus:
Specific Stock in focus ageas SA/NV (Ticker: AGS). The Stock is listed in the Euronext Brussels (The Brussels Stock Exchange), trade currency being in EUR.
Trade Direction:
BULLISH, Seasonality study for last 10 years reveal 90.0% probability of success in a BUY (LONG) trade for this week and also 90% probability for the trade next week (Week 40). Please see the Summary report screenshot later in the blog.
Overview:
ageas SA/NV, together with its subsidiaries, engages in insurance business in Europe and Asia. ageas SA/NV was founded in 1824 and is headquartered in Brussels, Belgium.
The company primarily offers property, casualty, and life insurance products, as well as pension products; and reinsurance products. Its life insurance products include risks related to the life and death of individuals; and non-life insurance products comprise accident and health, motor, fire, and other insurance products, as well as other damages to property covering the risk of property losses or claims liabilities. The company serves private individuals, as well as small, medium-sized, and large companies through independent brokers and the bank channels.
(Courtesy: Yahoo Finance)
Sector and Industry Details:
Sector(s): Financial Services
Industry: Insurance—Diversified
Full-time employees: 10,101
(Courtesy: Yahoo Finance)
Fundamentals:
52-week range 38.63 - 50.36
Avg. volume 328,085
Market cap 7.235B
Beta (5Y monthly) 0.79
PE ratio (TTM) 7.32
EPS (TTM) 5.39
Earnings date 10 Nov 2022
Ex-dividend date 01 June 2022
(Courtesy: Yahoo Finance)
Current trading price:
As of Friday, close of 23rd September 2022, the stock was trading at 39.44. All prices are in EUR.
SEASONALITY:
The stock demonstrated very strong SEASONAL move in week 39 of the year, here are some of the details of its SEASONAL behaviour.
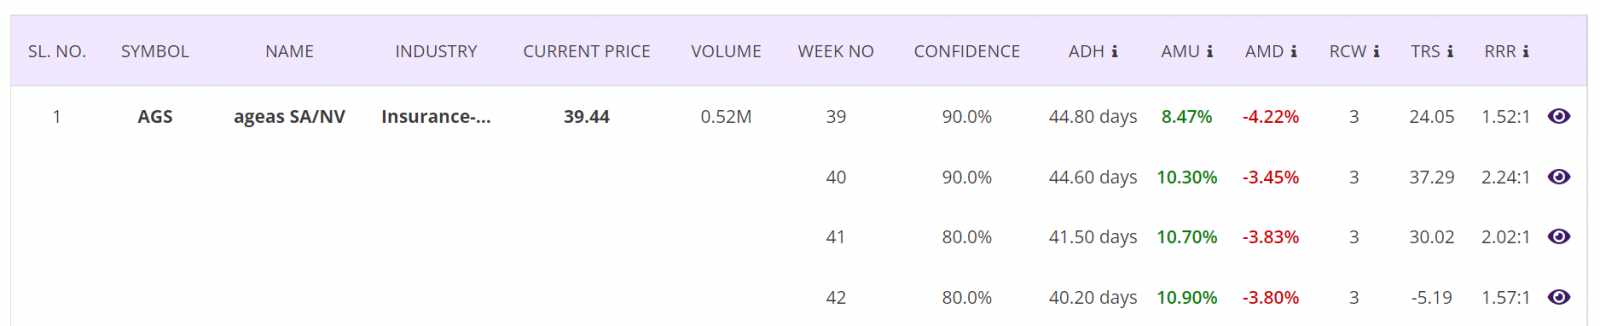
Summary report: In 9 out of last 10 years in week 39, the stock was BULLISH with average move up (AMU) of 8.47% and average move down (AMD) of 4.22% for an average holding time (ADH) of 45 days. The worst-case average Reward-Risk Ratio (RRR) for all 10 trades over last 10 years was 1.52:1. See the summary report table below:
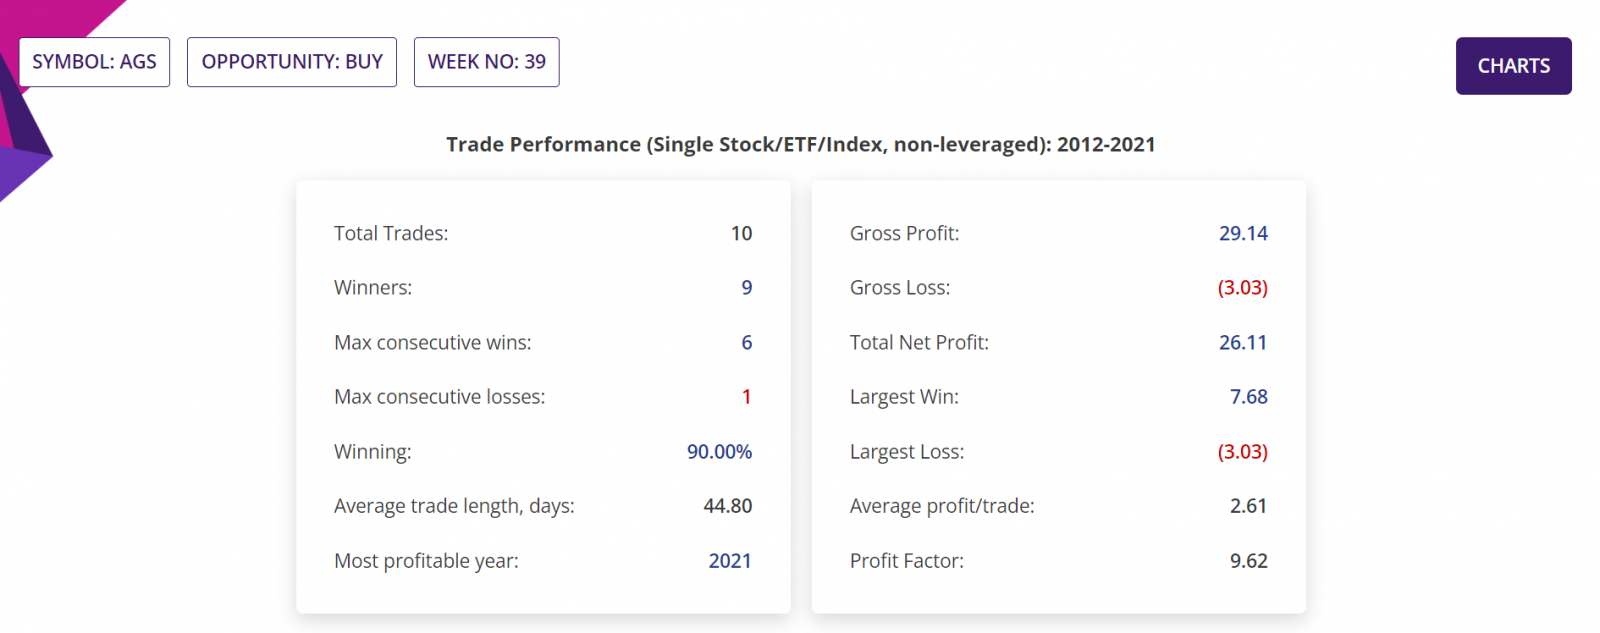
Detailed Report, Trade Performance: If 1,000 stocks were bought in the beginning of week 39 every year for last 10 years, then a trader would have had a Gross Profit of EUR29,140, Gross Loss of EUR3,030, making a Total Net Profit of EUR26,110.
In those 10 years, the Largest Win was EUR7,680, Largest Loss is EUR3,030, the Average profit/trade being EUR2,610. Profit factor (quotient of Gross Profit and Gross Loss) being 16.58. All figures excluding trading commissions. Please see the section of the detailed report below.
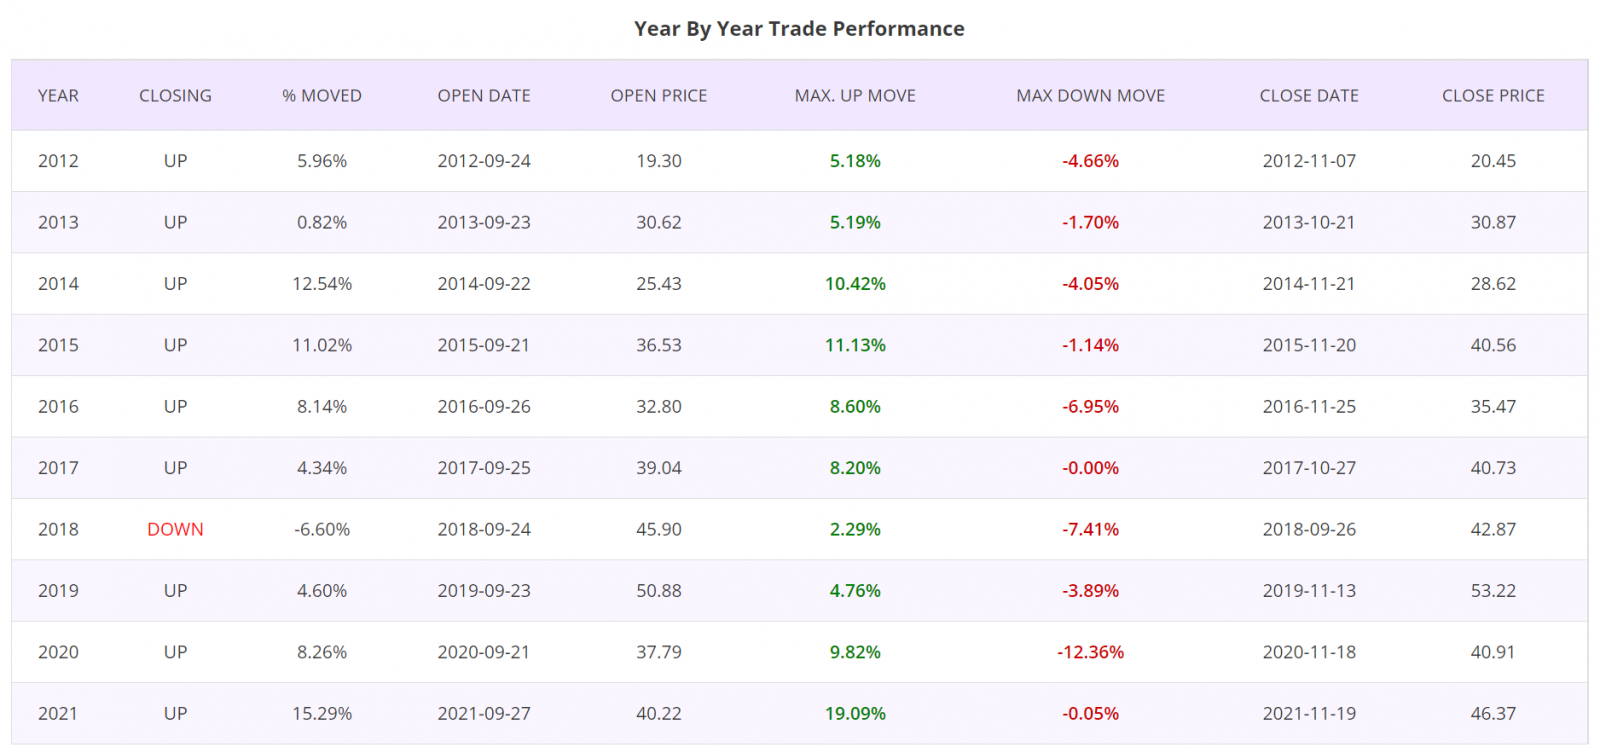
Detailed Report, Year by Year Trade Performance: Trades taken at the beginning of Week 39 for all years of last 10 years was winners, except for the year 2018. Please see the section of the detailed report below.
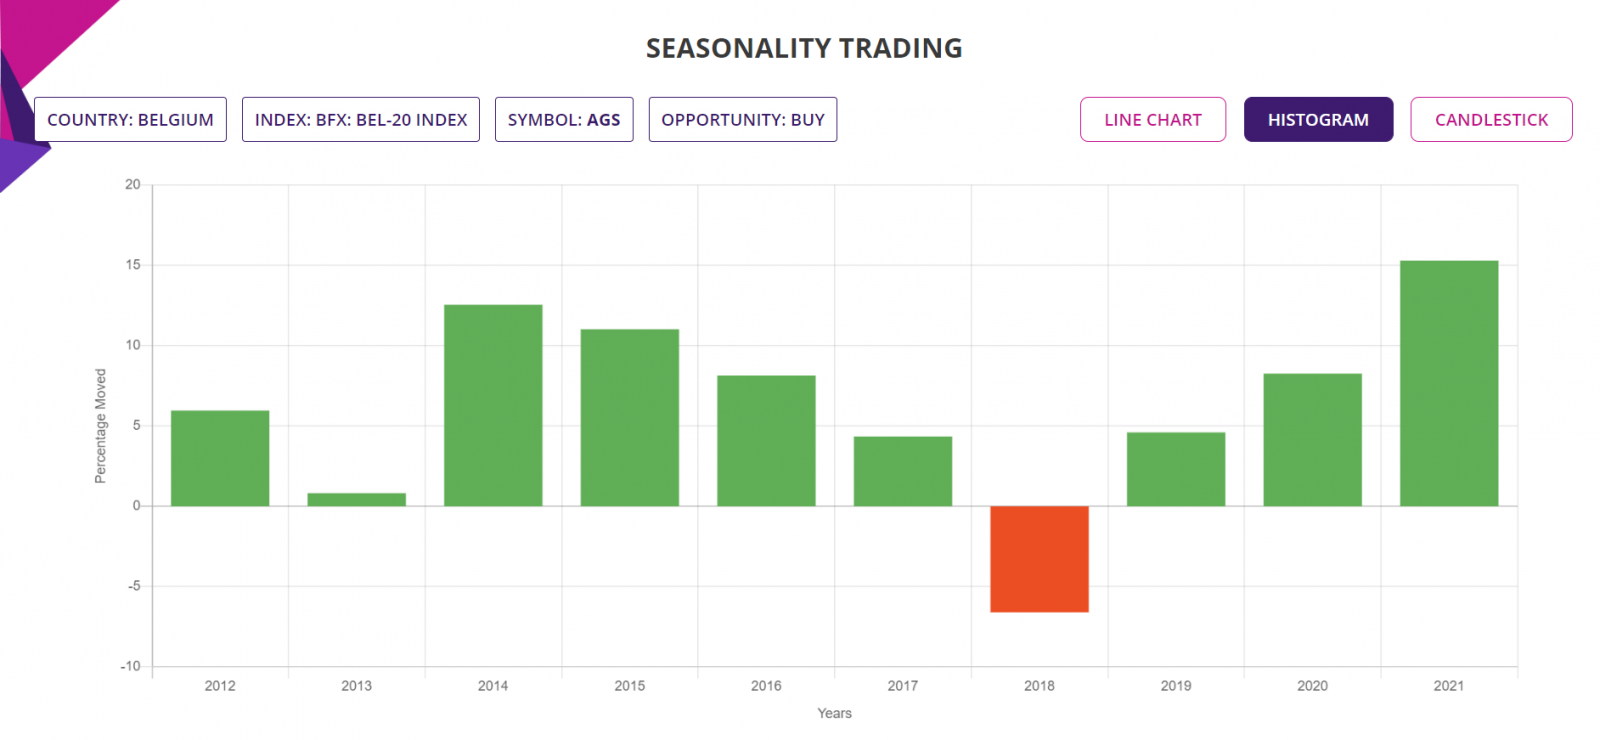
Histogram Chart: The chart below shows the percentage moves of the underlying Stock of Interest in each of the years in the Seasonality analysis, for a quick visual clue of the year-by-year trade performance.
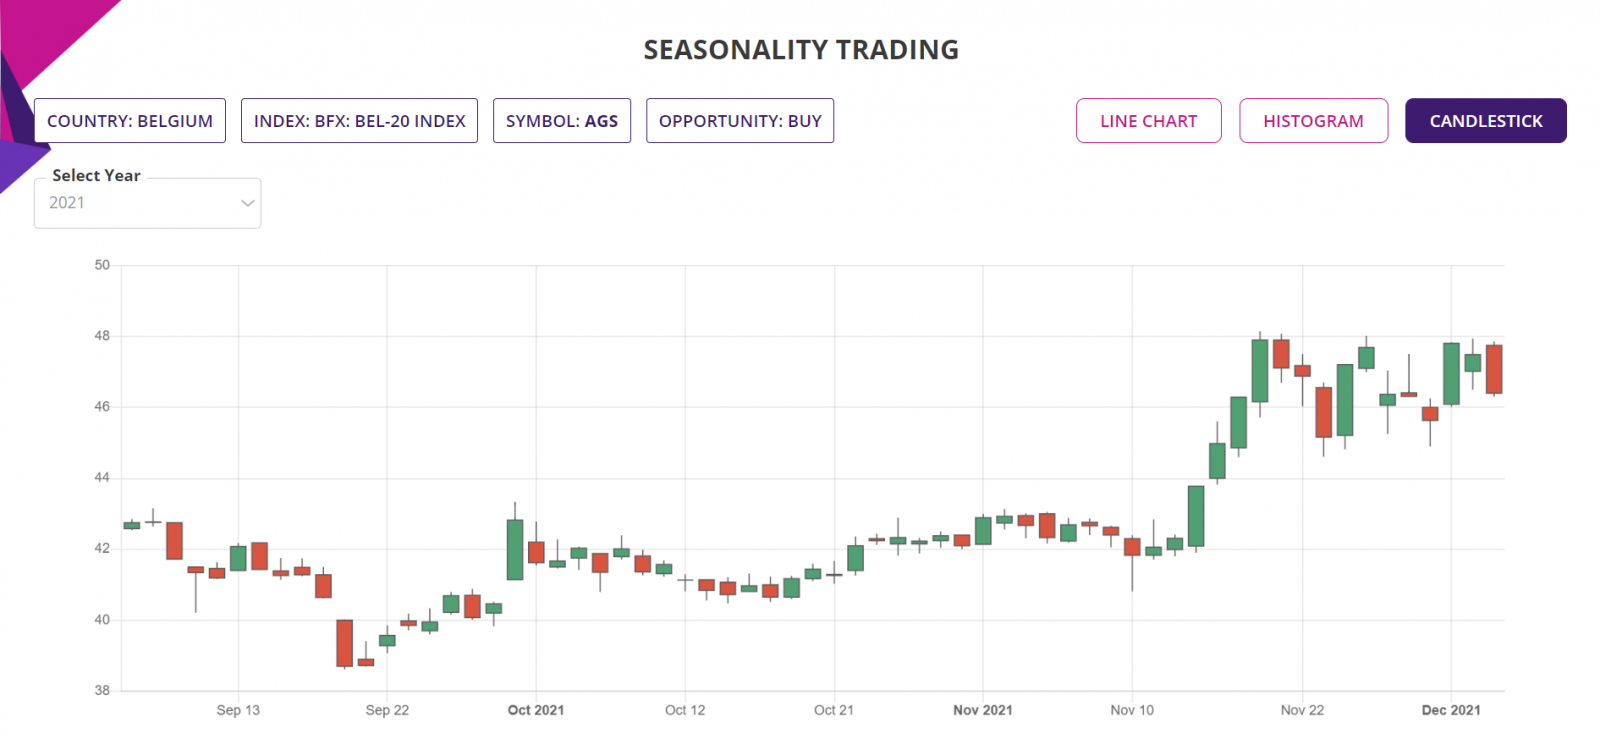
Candlestick Chart: The candlestick chart of the underlying Stock/ETF’s latest performance is as shown below. In the web-based Seasonality trading application, the chart is available for all the years of the Seasonality analysis.
Trade Structure:
If we had traded the Stock this week, then we would have structured the trade as follows:
|
TRADE STRUCTURE (All prices in Euro, EUR) |
||
|
Stock price |
39.44 |
Assuming trade placed at last traded price |
|
Stocks |
1,000 |
Number of Stocks used for this trade |
|
Investment required |
9,440 |
Amount of fund required for the trade |
|
|
|
|
|
Target Stock price (TP) |
48.10 |
22% above the current price |
|
Stop Stock price (SL) |
37.50 |
5% below the current price |
|
|
|
|
|
Profit Target |
8,660 |
Limit order placed at underlying TP price |
|
Stop Loss |
1,940 |
Guaranteed stop at SL price |
The choice of RRR of 4.46:1 is well over the worst-case averages of the 10 trades in each of the last 10 years in Week 39, since 2012 till 2021.
Further Information about trading applications:
Please visit the following URL for more information on various trading applications from Sapphire Capitals which are designed to deliver high probability trading opportunities for swing trading as well as for intraday trading:
https://www.sapphirecapitals.com/pages/swing-trading-stock-seasonality-strategy/
https://www.sapphirecapitals.com/pages/swing-trading-stock-price-action-strategy/
https://www.sapphirecapitals.com/pages/swing-trading-volume-spike-stock-trading-strategy/
https://www.sapphirecapitals.com/pages/day-trading-intraday-seasonality-trading/
Disclaimer:
Sapphire Private Assets (ABN: 34 613 892 023, trading as Sapphire Capitals) is not a broker or a financial adviser but an education and research organisation; we provide training and tools for traders and DIY fund managers for trading in global financial markets. The contents of the blog have been produced by using technical analysis and trading applications developed by Sapphire Capitals for the Stock and ETF traded worldwide. The contents of this blog are intended for education and research purposes only and is not a recommendation or solicitation to invest in any Stock or ETF.
For more details, please visit www.sapphirecapitals.com/Disclaimer.


