
-
 Admin123 :
Admin - Sapphire Capitals
Admin123 :
Admin - Sapphire Capitals -
 Date :
2022-09-18
Date :
2022-09-18
Stock In Focus - Week 38 (2022) – INDIA – SEASONALITY TRADING STRATEGY
The week beginning Monday, the 19th September is Week 38 as per ISO numbering convention of the weeks of a year.
Country in focus:
This week we look at the Stocks from India in NIFTY 500 index.
Stock/ETF in focus:
Specific Stock in focus TVS Motor Company Limited (Ticker: TVSMOTOR). The Stock is listed in the National Stock Exchange (NSE) of India, trade currency being in INR.
In fact, apart from this, there was another Stock of interest that popped up in our radar, but we decided to publish this one because of comparatively superior Seasonality performance of this Stock. The other Stock was State Bank of India (Ticker: SBI).
Trade Direction:
BULLISH, Seasonality study for last 10 years reveal 80.0% probability of success in a BUY (LONG) trade for the Week 38 and 80% probability for the trade next week (Week 39).
Overview:
TVS Motor Company Limited, together with its subsidiaries, manufactures and sells automotive vehicles and components, spare parts, and accessories in India. It operates through Automotive Vehicles and Parts, Automotive Components, Financial Services, and others segments. The company offers motorcycles under the Apache, Radeon, Raider, StaR City+, and Sport brand names; scooters under the Ntorq, Jupiter, Zest 110, and Scooty Pep+ brands; mopeds under the XL 100, XL 100 Comfort, XL100 Heavy Duty, XL 100 Comfort i-TOUCH start, and XL 100 Heavy Duty i-TOUCH start brand names; electric vehicles under the TVS iQUBE brand; and three wheelers under the TVS King brand name. It also provides e-mobility solutions under the Cilo, Simpel, Allegro, and Zenith-Bikes brands; and financing for two-wheelers. The company operates in the Middle East, Africa, Southeast Asia, and Latin and Central America. It distributes its products through a network of authorized dealers. The company was incorporated in 1992 and is based in Chennai, India. TVS Motor Company Limited is a subsidiary of Sundaram-Clayton Limited.
(Courtesy: Yahoo Finance)
Sector and Industry Details:
Sector(s): Consumer Cyclical
Industry: Auto Manufacturers
Full-time employees: 5,161
(Courtesy: Yahoo Finance)
Fundamentals:
52-week range 513.00 - 1,071.35
Volume 1,601,641
Avg. volume 1,796,747
Market cap 486.204B
Beta (5Y monthly) 0.56
PE ratio (TTM) 45.39
EPS (TTM) 22.58
Ex-dividend date 25 Mar 2022
(Courtesy: Yahoo Finance)
Current trading price:
As of Friday, close of 16th September 2022, the stock was trading at 1024.90. All prices are in INR.
SEASONALITY:
The stock demonstrated very strong SEASONAL move in week 37 of the year, here are some of the details of its SEASONAL behaviour:
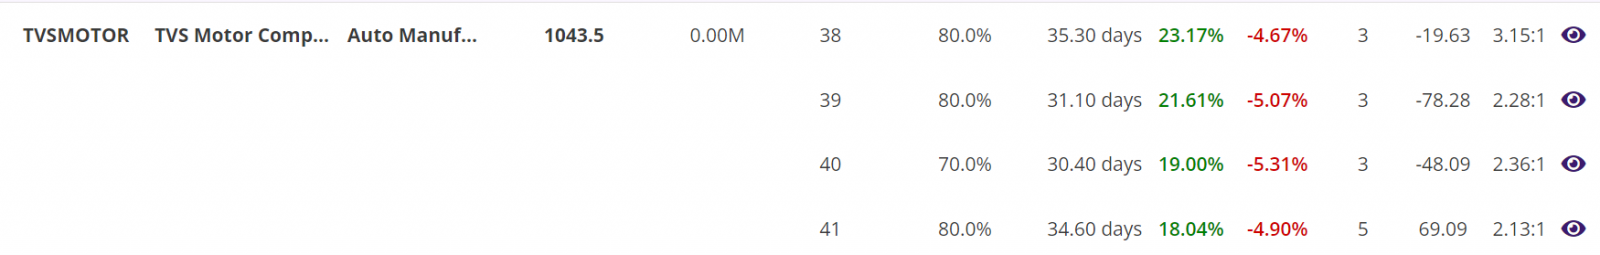
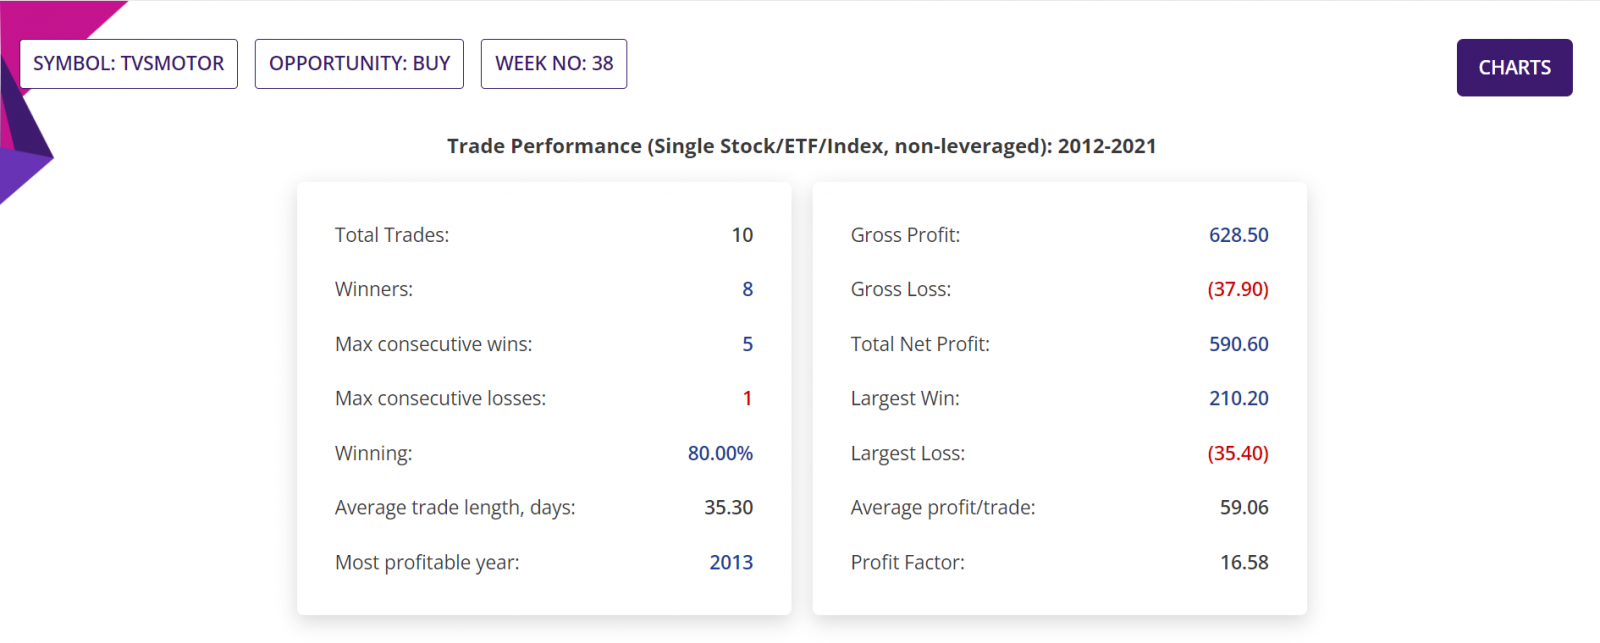
- In 8 out of last 10 years in week 38, the stock was BULLISH with average move up (AMU) of 23.17% and average move down (AMD) of 4.67% for an average holding time (ADH) of 35 days.
- If 100 stocks were bought in the beginning of week 38 every year for last 10 years, then a trader would have had a Gross Profit of INR62,850, Gross Loss of INR3,790, making a Total Net Profit of INR59060. All figures excluding trading commissions.
- In those 10 years, the Largest Win was INR21,020, Largest Loss is INR3.540, the Average profit/trade being INR5,906. All figures excluding trading commissions.
- The worst-case average Reward-Risk Ratio (RRR) for all 10 trades over last 10 years was 3.15:1 and Profit factor (the quotient of Gross Profit and Gross Loss) being 16.58.
Trade Structure:
If we had traded the Stock this week, then we would have structured the trade as follows:
|
TRADE STRUCTURE (All prices in Indian Rupees, INR) |
||
|
Stock price |
1,024.90 |
Assuming trade placed at last traded price |
|
Stocks (example) |
100 |
Number of Stocks used for this trade |
|
Investment required |
1,02,490 |
Amount of fund required for the trade |
|
Target Stock price (TP) |
1,127.39 |
10% above the current price |
|
Stop Stock price (SL) |
994.15 |
3% below the current price |
|
Profit Target |
10,249 |
Limit order placed at underlying TP price |
|
Stop Loss |
3,075 |
Guaranteed stop at SL price |
The choice of RRR of 3.33:1 is historically consistent with the worst-case averages of the 10 trades in each of the last 10 years in Week 38, since 2012 till 2021.
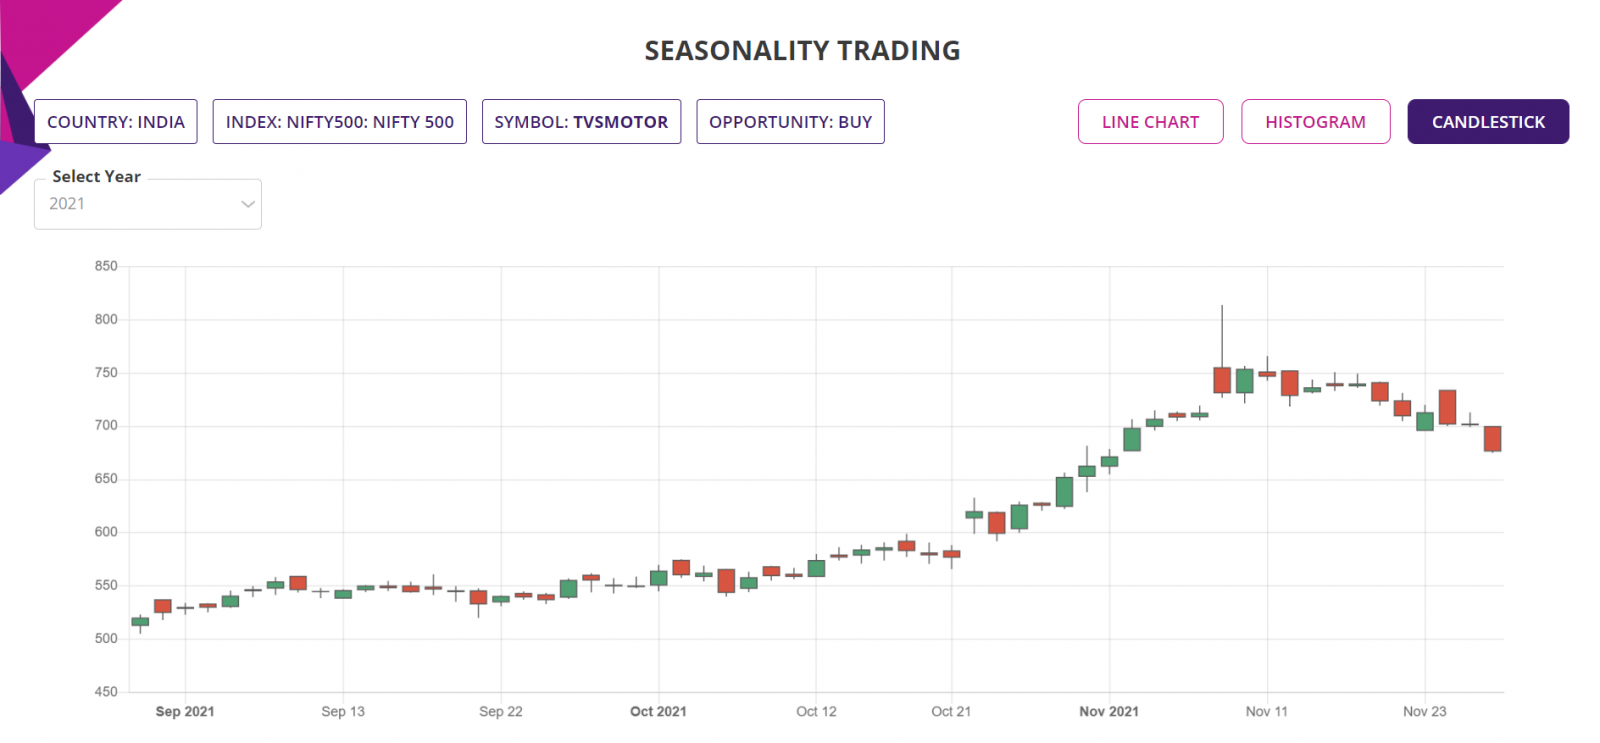
Charts:
Summary report extract:
Trade Performance (Single Stock/ETF/Index, non-leveraged): 2012-2021:
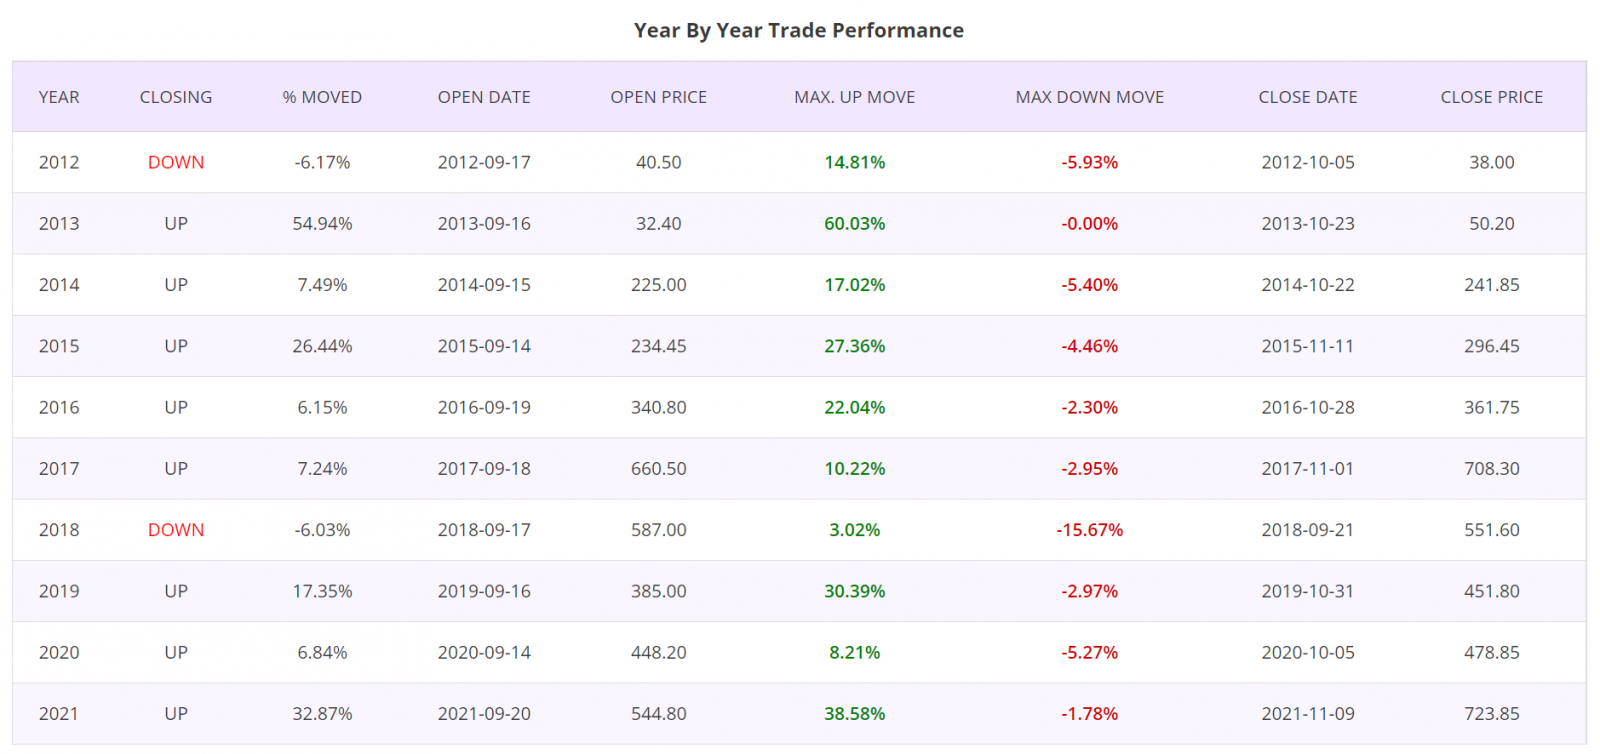
Year by year Trade Performance:
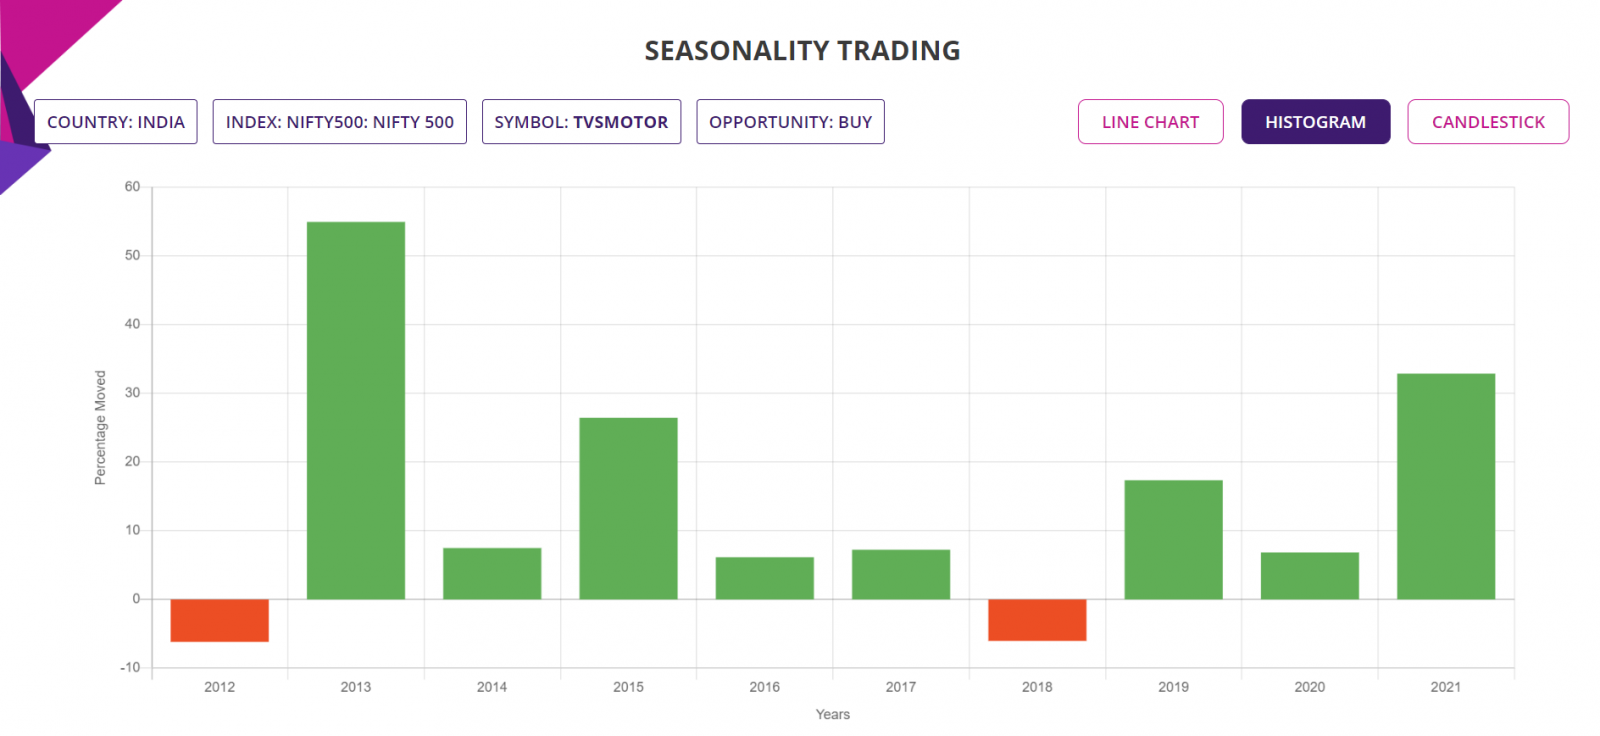
Histogram:
Latest event candlestick chart:
Further Information about trading applications:
Please visit the following URL for more information on various trading applications from Sapphire Capitals which are designed to deliver high probability trading opportunities for swing trading as well as for intraday trading:
https://www.sapphirecapitals.com/pages/swing-trading-stock-seasonality-strategy/
https://www.sapphirecapitals.com/pages/swing-trading-stock-price-action-strategy/
https://www.sapphirecapitals.com/pages/swing-trading-volume-spike-stock-trading-strategy/
https://www.sapphirecapitals.com/pages/day-trading-intraday-seasonality-trading/
Disclaimer:
Sapphire Private Assets (ABN: 34 613 892 023, trading as Sapphire Capitals) is not a broker or a financial adviser but an education and research organisation; we provide training and tools for traders and DIY fund managers for trading in global financial markets. The contents of the blog have been produced by using technical analysis and trading applications developed by Sapphire Capitals for the Stock and ETF traded worldwide. The contents of this blog are intended for education and research purposes only and is not a recommendation or solicitation to invest in any Stock or ETF.
For more details, please visit www.sapphirecapitals.com/Disclaimer.


