
-
 Admin123 :
Admin - Sapphire Capitals
Admin123 :
Admin - Sapphire Capitals -
 Date :
2022-09-04
Date :
2022-09-04
Stock of interest - Week 36 (2022) – USA – PRICE ACTION TRADING
The week beginning Monday, the 5th September is Week 36 as per ISO numbering convention of the weeks of a year.
Country in focus:
This week we look at the Stocks from USA in GSPC: S&P 500 index.
Stock/ETF in focus:
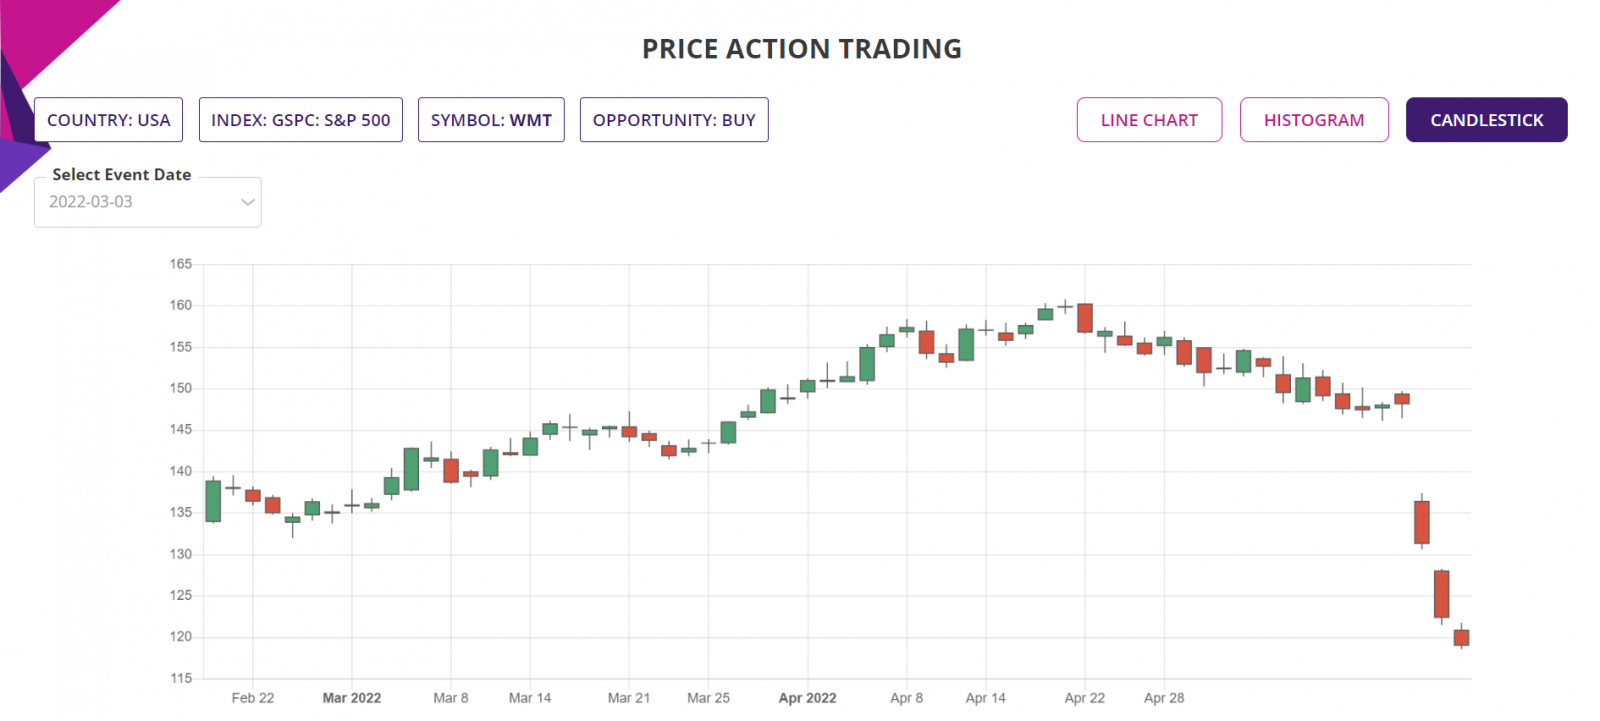
Specific Stock in focus is Walmart Inc. (Ticker: WMT). The trading currency is US Dollars or $.
Trade Direction:
BULLISH, Price Action study since 2020 reveal 85% probability of success with RRR of over 1.3:1 in a BUY (LONG) trade.
Most Recent Event: Most recent Price Action event was on Thursday, the 1st September. Preferred trade opening is the next market open day on Monday, the 5th September.
Overview:
Walmart Inc. engages in the operation of retail, wholesale, and other units worldwide. The company operates through three segments: Walmart U.S., Walmart International, and Sam's Club. It operates supercentres, supermarkets, hypermarkets, warehouse clubs, cash and carry stores, and discount stores; membership-only warehouse clubs; ecommerce websites, such as walmart.com, walmart.com.mx, walmart.ca, flipkart.com, and samsclub.com; and mobile commerce applications. The company offers grocery and consumables, which includes dairy, meat, bakery, deli, produce, dry, chilled or frozen packaged foods, alcoholic and non-alcoholic beverages, floral, snack foods, candy, other grocery items, health and beauty aids, paper goods, laundry and home care, baby care, pet supplies, and other consumable items; and health and wellness products covering pharmacy, over-the-counter drugs and other medical products, and optical and hearing services. It also provides gasoline stations and tobacco; home improvement, outdoor living, gardening, furniture, apparel, jewellery, tools and power equipment, housewares, toys, seasonal items, mattresses, and tire and battery centres; and consumer electronics and accessories, software, video games, office supplies, appliances, and third-party gift cards. In addition, the company offers fuel and financial services and related products, including money orders, prepaid cards, money transfers, and check cashing and bill payment, as well as various types of instalment lending. It operates approximately 10,500 stores and various e-commerce websites under 46 banners in 24 countries. The company was formerly known as Wal-Mart Stores, Inc. and changed its name to Walmart Inc. in February 2018. The company was founded in 1945 and is based in Bentonville, Arkansas.
(Courtesy: Yahoo Finance)
Sector and Industry Details:
Sector(s): Consumer Defensive
Industry: Discount Stores
Full-time employees: 2,300,000
(Courtesy: Yahoo Finance)
Fundamentals:
52-week range 117.27 - 160.77
Avg. volume 8,350,485
Market cap 364.573B
Beta (5Y monthly) 0.54
PE ratio (TTM) 26.60
EPS (TTM) 5.00
Forward dividend & yield 2.24 (1.68%)
Ex-dividend date 08 Dec 2022
1y target estimate 149.45
(Courtesy: Yahoo Finance)
Current trading price:
As of Thursday, the 1st September 2022, or the day the Price Action event took place, the stock was trading at 134.48. The last closing price on Friday, the 2nd September was 133.00. The trading currency is US Dollars or USD.
PRICE ACTION:
The Stock was bullish 85% of the time following Price action events since the beginning of 2020. Here is the key Price Action event performance of the Stock:
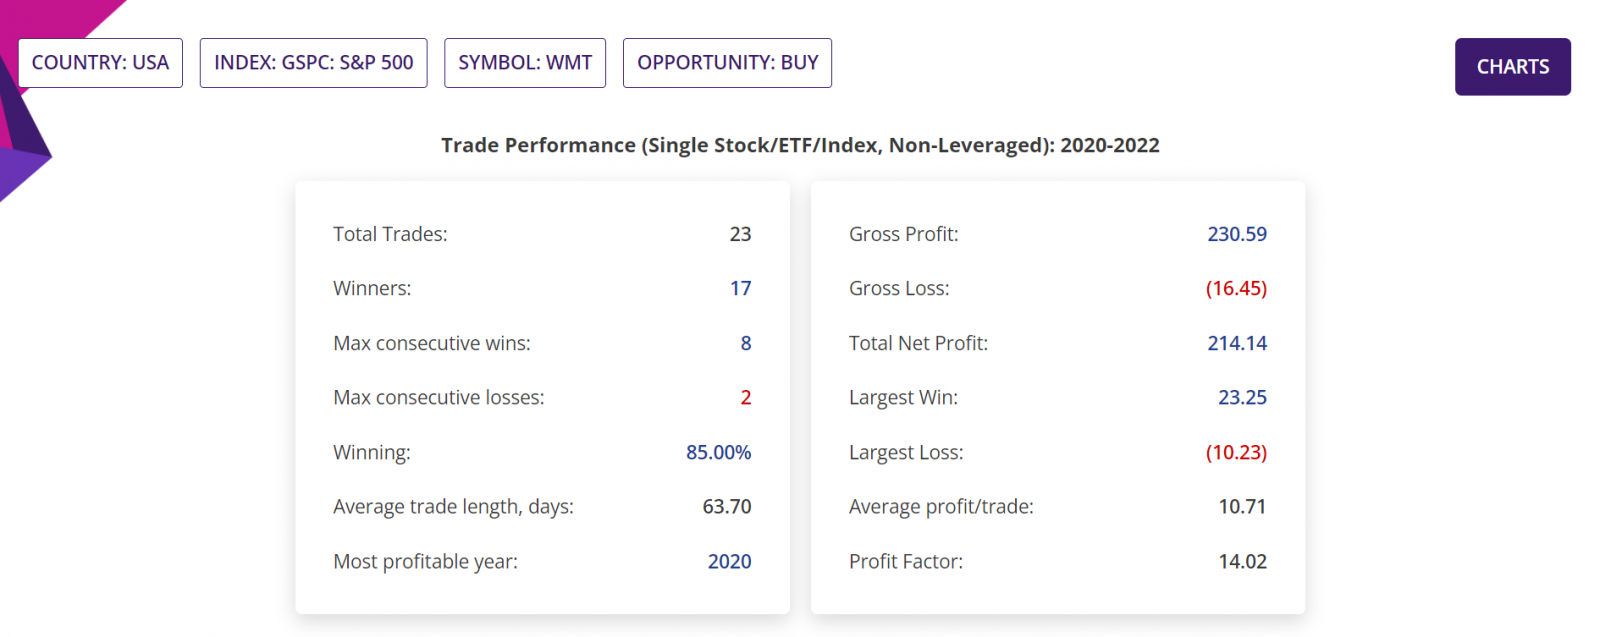
- Since beginning of 2020, there were 23 BULLISH Price action events, of which three events are still in open trade. These leaves 20 completed trades, of which 17 were winners with average move up (AMU) of 9.39% and average move down (AMD) of 4.05% for an average holding time (ADH) of 38 days. One latest BULLISH Price Action event is the trading opportunity discussed in this blogpost;
- If 100 stocks were bought following those BULLISH Price action events, then a trader would have had a Gross Profit of 23,059, Gross Loss of 1,645, making a Total Net Profit of 21,414;
- In those trades, the Largest Win was 2,325, Largest Loss is 1,023, the Average profit/trade being 1,071.
- The Profit Factor in those trades was 14 and historical RRR was about 1.3:1. Please note that RRR shown here is a worst-case scenario, as many trades could be closed sooner with higher profit compared to trades closed at the end of 9 week period.
Trade Structure:
This week, for this trading opportunity, you could trade in many different ways, depending upon which country where you are located. Here are some ideas:
- Stock: If you are in a country where no derivative trading is allowed, you could trade the opportunity as simple Stock BUY and SELL, with predefined TP and SL;
- CFD: If you live in Australia or some of the European countries where CFD trading is allowed, you could trade at 10:1 or 20:1 margin, thus dramatically increasing the RoI, but with same SL and TP as regular Stock trade. But please be fully aware of the risks associated with CFD trading, the guaranteed stop requirements and interest on margin to be paid daily, for each day the trade is held;
- Options: USA has very liquid Options market and this Stock is heavily traded. As such, traders in living in USA or other countries who have access to trading US Options market, you could trade this opportunity as Debit spread or Credit spread, thus fully being in control of the RRR of the trade. Details of such trading strategies are available in our Trading Proficiency Training Program Level 1, to be available soon.
Charts:
Summary report extract:

Trade Performance (Single Stock/ETF/Index, non-leveraged):
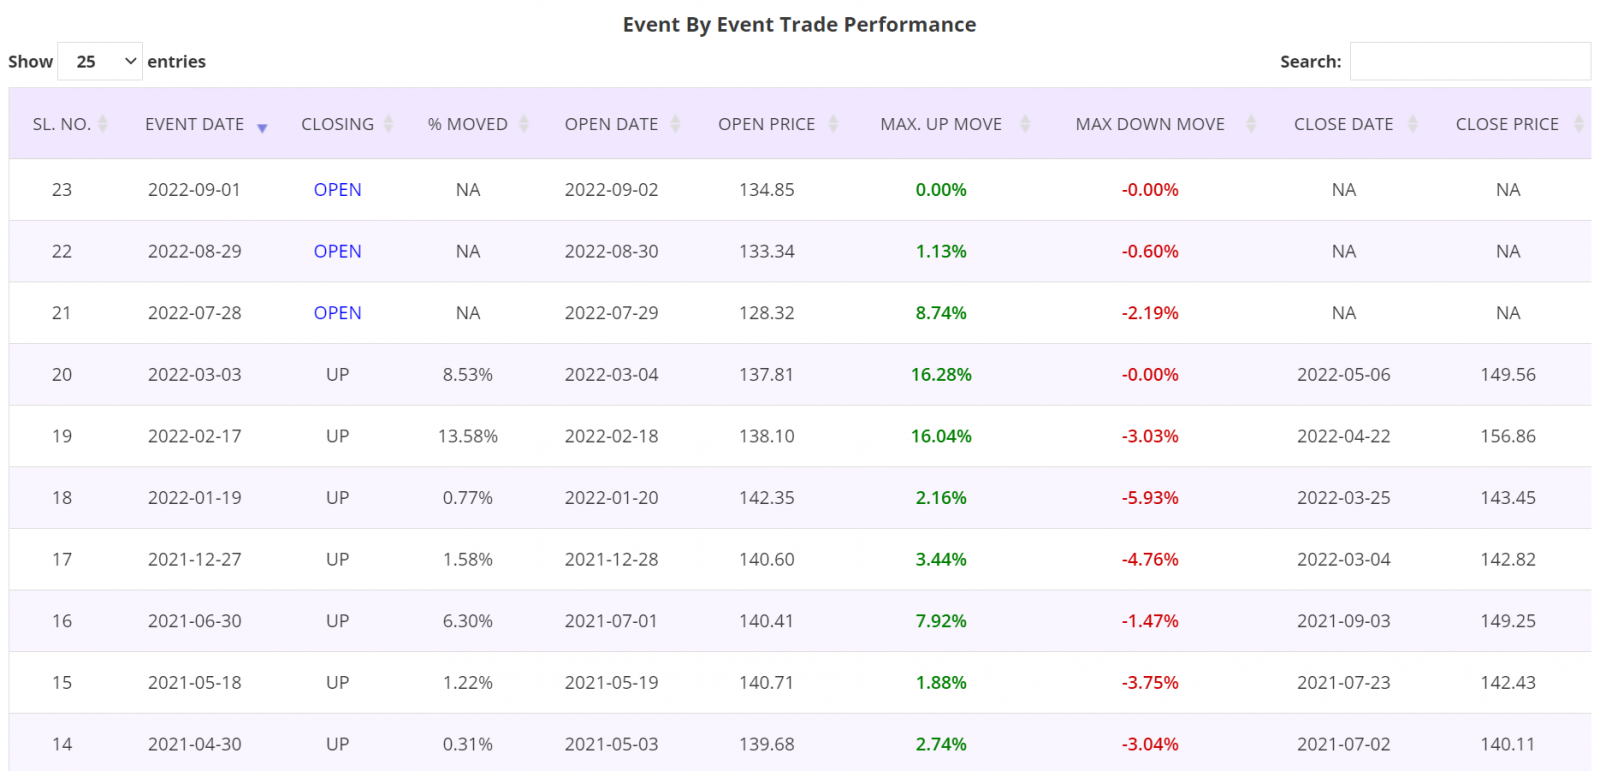
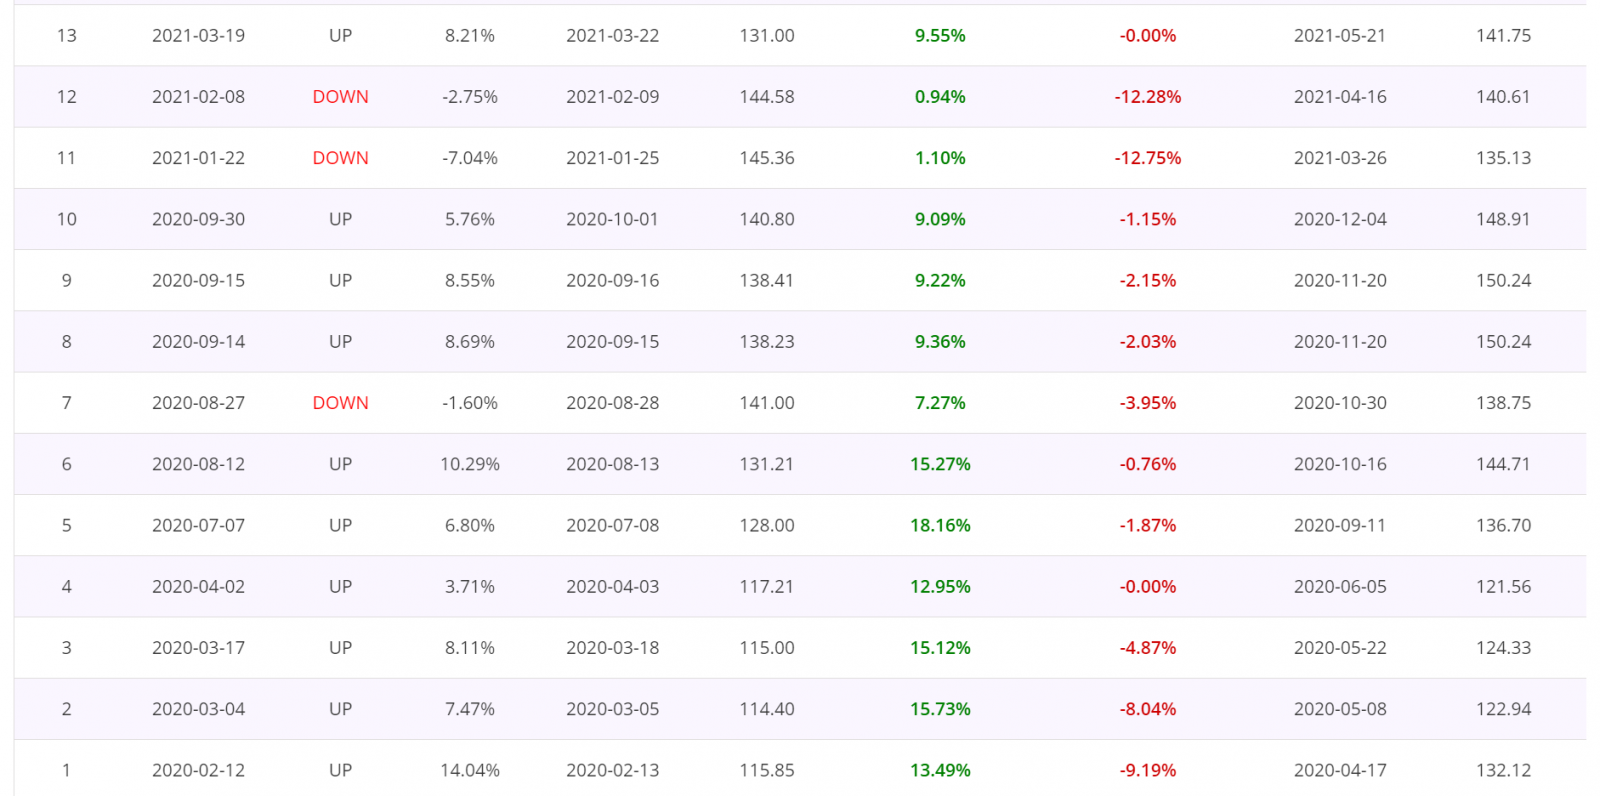
Price Action Event by event trade performance report:
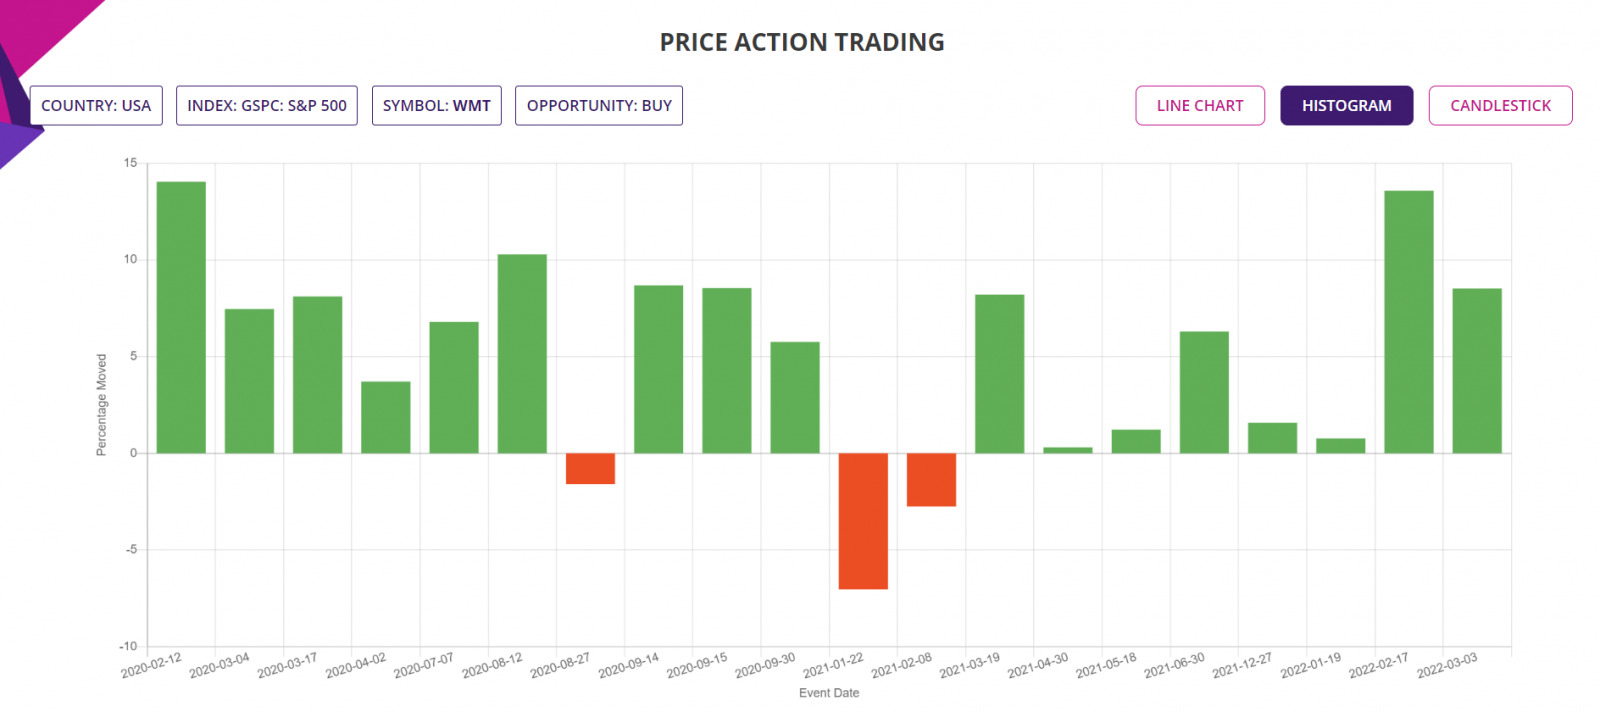
Histogram:
Latest event candlestick chart:
Further Information about trading applications:
Please visit the following URL for more information on various trading applications from Sapphire Capitals which are designed to deliver high probability trading opportunities for swing trading as well as for intraday trading:
https://www.sapphirecapitals.com/pages/swing-trading-stock-seasonality-strategy/
https://www.sapphirecapitals.com/pages/swing-trading-stock-price-action-strategy/
https://www.sapphirecapitals.com/pages/swing-trading-volume-spike-stock-trading-strategy/
https://www.sapphirecapitals.com/pages/day-trading-intraday-seasonality-trading/
Disclaimer:
Sapphire Private Assets (ABN: 34 613 892 023, trading as Sapphire Capitals) is not a broker or a financial adviser but an education and research organisation; we provide training and tools for traders and DIY fund managers for trading in global financial markets. The contents of the blog have been produced by using technical analysis and trading applications developed by Sapphire Capitals for the Stock and ETF traded worldwide. The contents of this blog are intended for education and research purposes only and is not a recommendation or solicitation to invest in any Stock or ETF.
For more details, please visit www.sapphirecapitals.com/Disclaimer.


