
-
 Admin123 :
Info - Sapphire Capitals
Admin123 :
Info - Sapphire Capitals -
 Date :
2022-08-28
Date :
2022-08-28
Stock In Focus - Week 35 (2022) – INDIA – PRICE ACTION TRADING
The week beginning Monday, the 29th August is Week 35 as per ISO numbering convention of the weeks of a year.
Country in focus:
This week we look at the Stocks from INDIA in NIFTY500: NIFTY 500 index.
Stock/ETF in focus:
Specific Stock in focus is Indian Bank (NSE Ticker: INDIANB). The trading currency is INR.
Trade Direction:
BULLISH, Price Action study since 2020 reveal 90% probability of success with RRR of over 8:1 in a BUY (LONG) trade.
Most Recent Event: Price Action event on 25th August 2022, which was Thursday. Preferred trade opening is the next market open day of 29th August 2022.
Overview:
Indian Bank provides various banking products and services. The company offers deposit products, including savings bank and current accounts, term deposits, and non-resident Indian (NRI) accounts. It also provides agriculture, group, personal/individual, MSME, corporate, education, and NRI loans. In addition, the company provides digital products; and applications supported by blocked amount and centralized pension processing services, as well as central schemes to provide interest subsidy. It operates through 5732 branches in India and 3 overseas branches; and 4925 ATMs and BNAs. The company was incorporated in 1907 and is based in Chennai, India.
(Courtesy: Yahoo Finance)
Sector and Industry Details:
Sector(s): Financial Services
Industry: Banks—Regional
Full-time employees: 39,734
Fundamentals:
52-week range 120.60 - 196.90
Avg. volume 1,700,687
Market cap 241.013B
PE ratio (TTM) 5.88
EPS (TTM) 32.91
Earnings date 23 Jan 2018 - 27 Jan 2018
Forward dividend & yield 6.50 (3.71%)
Ex-dividend date 14 June 2022
Current trading price:
As of Thursday, the 25th August 2022, or the day the Price Action event took place, the stock was trading at 189.25. The last closing price on Friday, the 26th of August was 193.35. The trading currency is Indian Rupees or INR.
PRICE ACTION:
The Stock was bullish 90% of the time following Price action events since beginning of 2020. Here is the key Price Action event performance of the Stock:
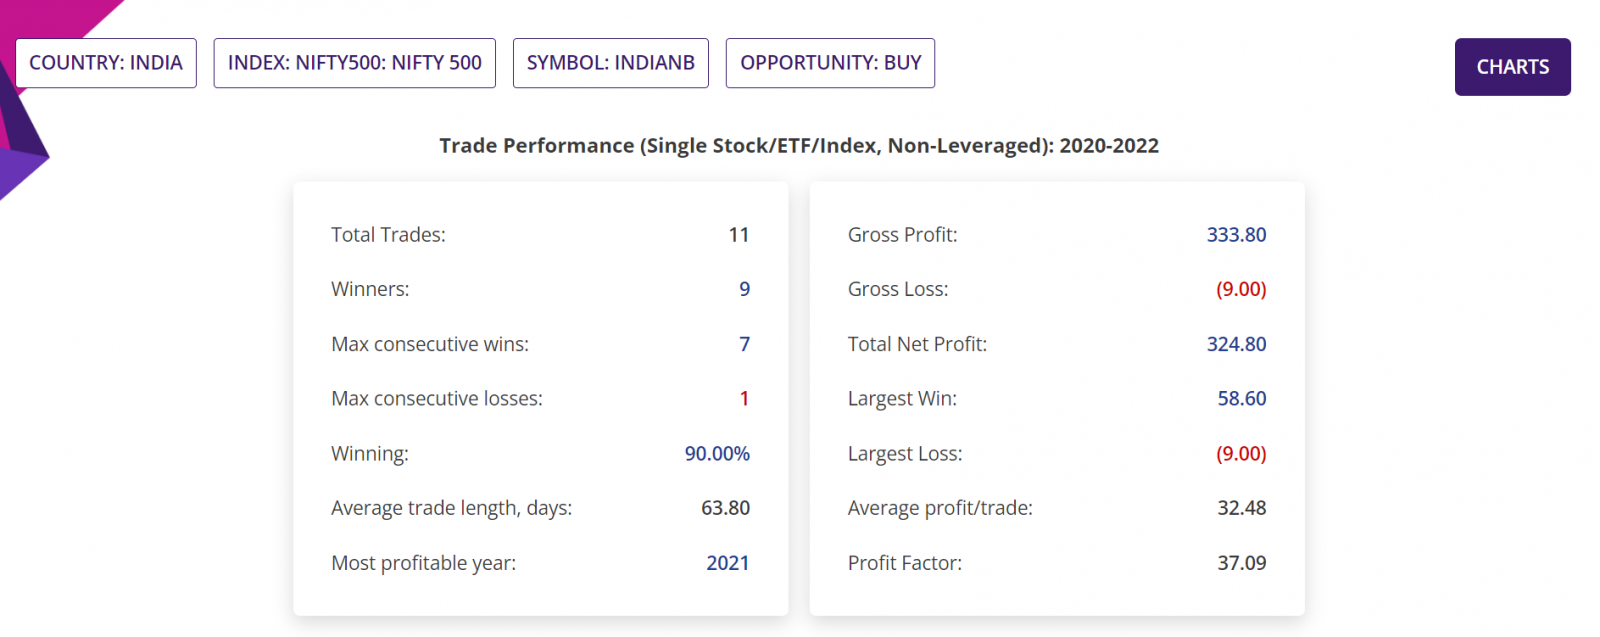
- Since beginning of 2020, there were 11 BULLISH Price action events, out of which 9 were winners with average move up (AMU) of 42.80% and average move down (AMD) of 5.17% for an average holding time (ADH) of 33 days. One BULLISH Price Action event is the trading opportunity discussed in this blogpost;
- If 1,000 stocks were bought following those BULLISH Price action events, then a trader would have had a Gross Profit of INR3,33,800, Gross Loss of INR9,000, making a Total Net Profit of INR3,24,800;
- In those trades, the Largest Win was INR58,600, Largest Loss is INR9,000, the Average profit/trade being INR32,480.
- The Profit Factor in those trades was 37 and historical RRR was about 8.3:1.
Trade Structure:
We would trade the Stock as it is, by allocating a fund no more than 2% of the trading capital as below:
|
TRADE STRUCTURE (All prices in Indian Rupees, INR) |
||
|
Stock price |
193.00 |
Assuming trade placed at last traded price |
|
Stocks |
1,000 |
Number of Stocks used for this trade |
|
Investment required |
193,000 |
Amount of fund required for the trade |
|
Target Stock price (TP) |
241.25 |
25% above the current price |
|
Stop Stock price (SL) |
183.35 |
5% below the current price |
|
Profit Target |
48,250 |
Limit order placed at underlying TP price |
|
Stop Loss |
9,650 |
Guaranteed stop at SL price |
This gives us a RRR of 5:1, which is higher than the average of 8.3:1 following the Price Action events since beginning of 2020.
Charts:
Summary report extract:

Trade Performance (Single Stock/ETF/Index, non-leveraged): 2020-2022:
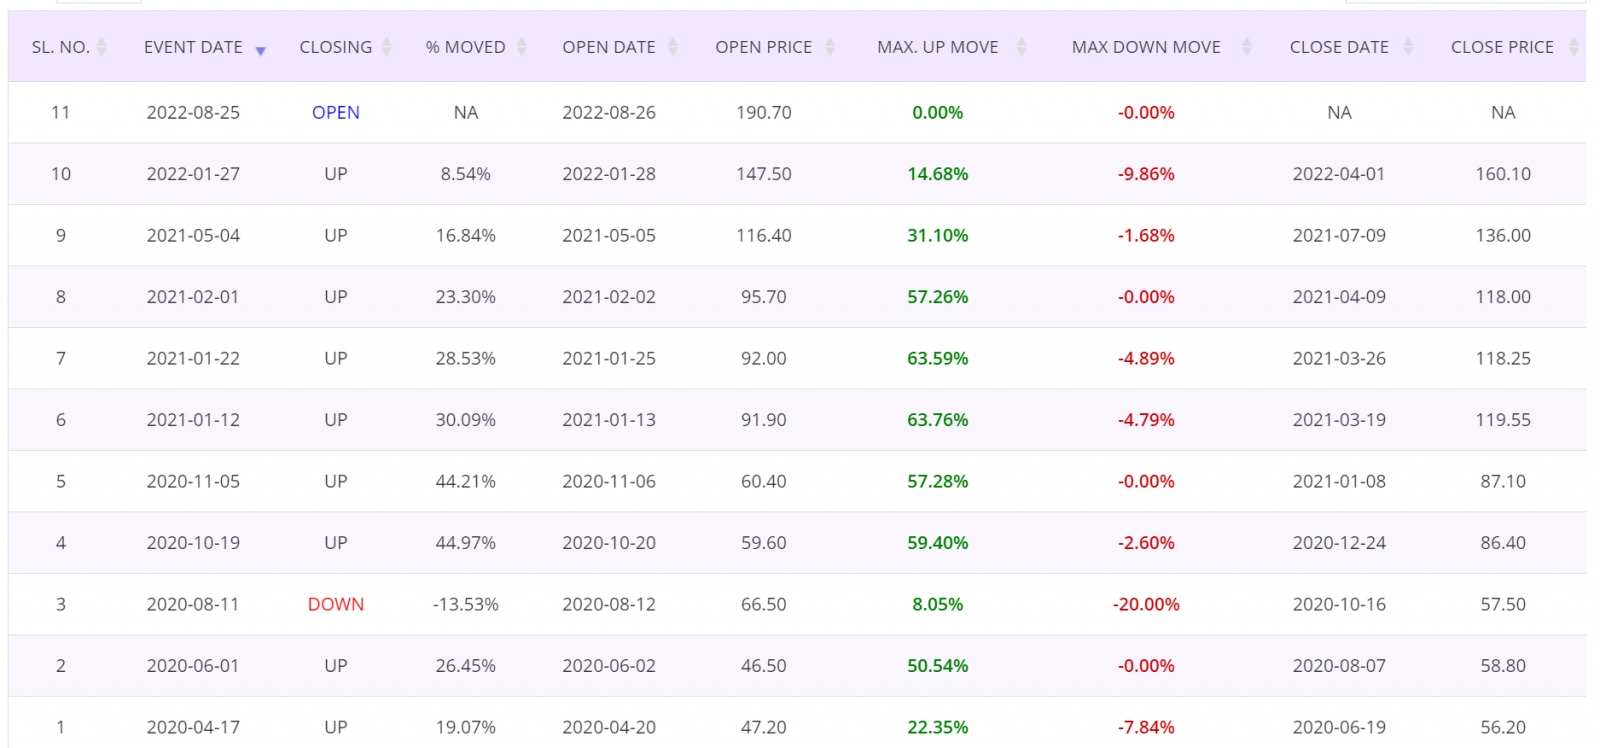
Trade by trade performance (2020 - 2022)
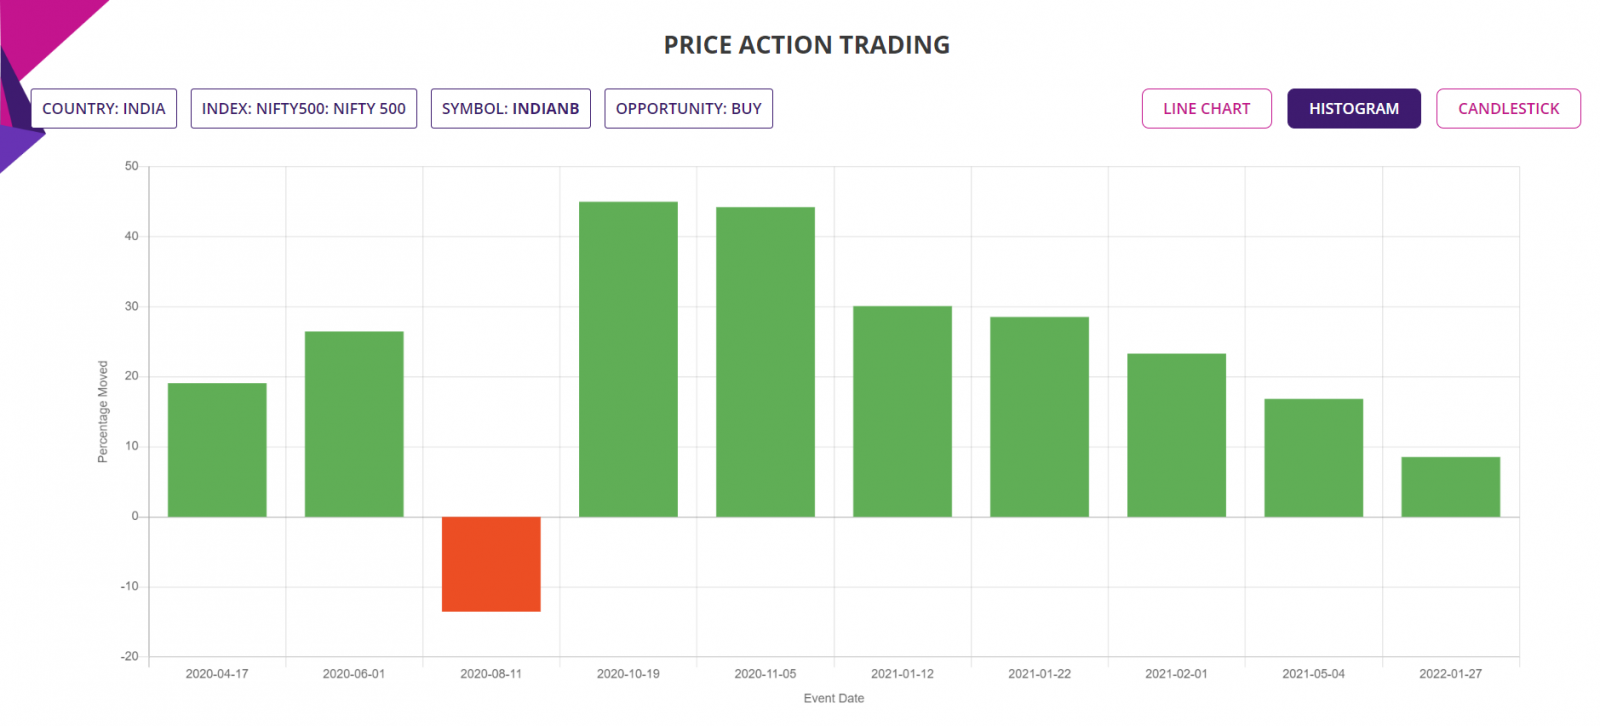
Histogram:
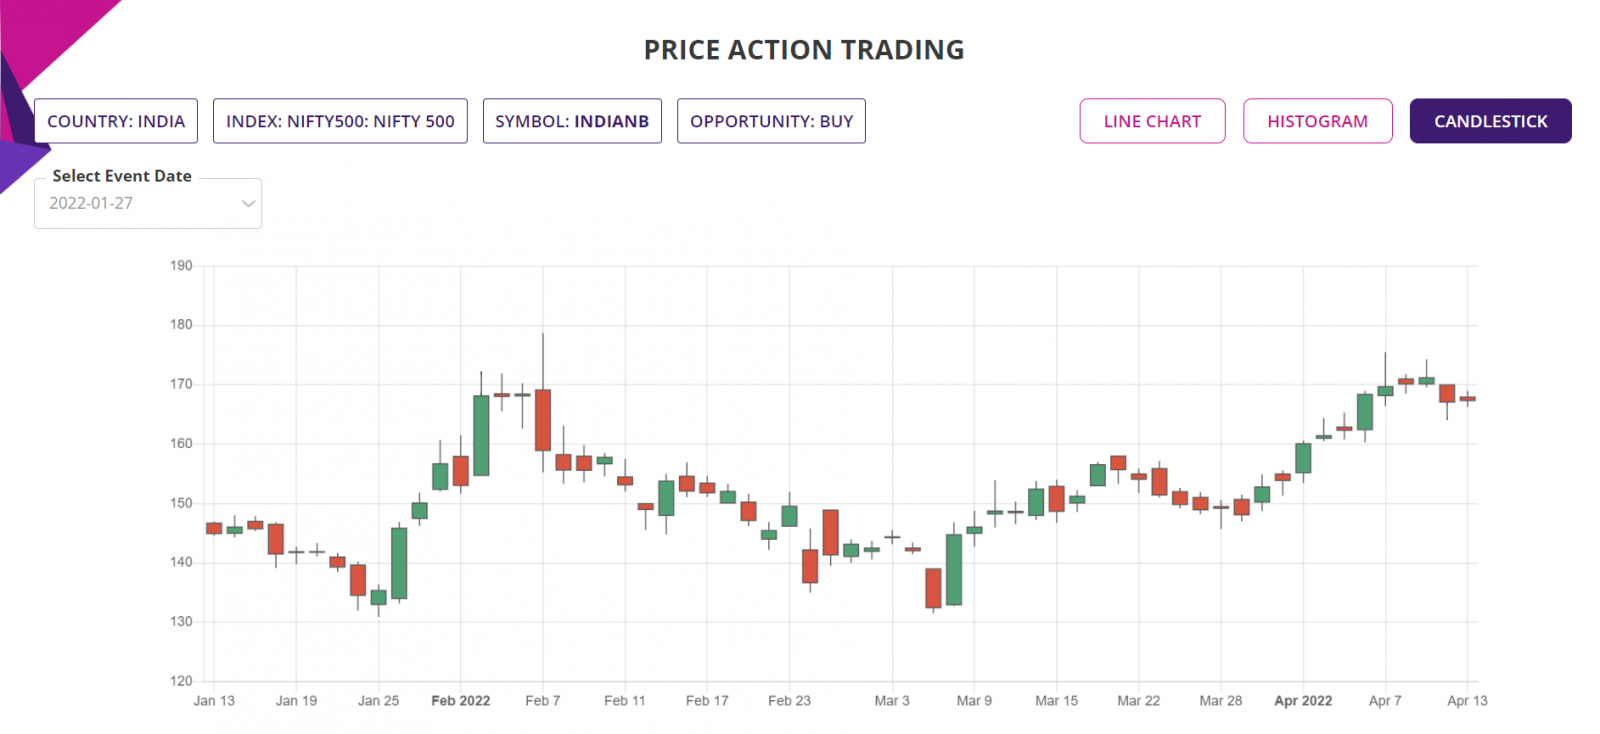
Latest event candlestick chart:
Further Information about trading applications:
Please visit the following URL for more information on various trading applications from Sapphire Capitals which are designed to deliver high probability trading opportunities for swing trading as well as for intraday trading:
https://www.sapphirecapitals.com/pages/swing-trading-stock-seasonality-strategy/
https://www.sapphirecapitals.com/pages/swing-trading-stock-price-action-strategy/
https://www.sapphirecapitals.com/pages/swing-trading-volume-spike-stock-trading-strategy/
https://www.sapphirecapitals.com/pages/day-trading-intraday-seasonality-trading/
Disclaimer:
Sapphire Private Assets (ABN: 34 613 892 023, trading as Sapphire Capitals) is not a broker or a financial adviser but an education and research organisation; we provide training and tools for traders and DIY fund managers for trading in global financial markets. The contents of the blog have been produced by using technical analysis and trading applications developed by Sapphire Capitals for the Stock and ETF traded worldwide. The contents of this blog are intended for education and research purposes only and is not a recommendation or solicitation to invest in any Stock or ETF.
For more details, please visit www.sapphirecapitals.com/Disclaimer.


