-
 Admin123 :
Admin - Sapphire Capitals
Admin123 :
Admin - Sapphire Capitals -
 Date :
2022-08-21
Date :
2022-08-21
Stock In Focus - Week 34 (2022) – NETHERLANDS – SEASONALITY (WATCH ONLY)
The week beginning Monday, the 22nd August is Week 34 as per ISO numbering convention of the weeks of a year.
Country in focus:
This week we look at the Stocks from NETHERLANDS in AEX AMSTERDAM index.
Stock/ETF in focus:
Specific Stock in focus Aegon N.V. (Amsterdam Stock Exchange ticker: AGN), trade currency being EUR.
Trade Direction:
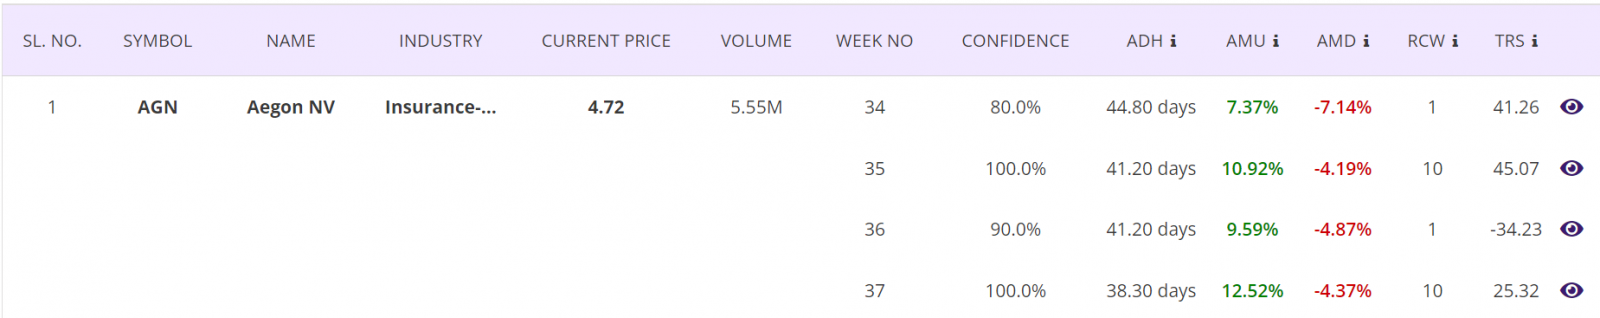
BULLISH, Seasonality study for last 10 years reveal 80.0% probability of success in a BUY (LONG) trade for this week and 100% probability for the trade next week (Week 35). Please note this Stock trade may not achieve the minimum RRR we would like to achieve. So, we would keep this trade as one to watch only and NOT trade unless a very small fund is allocated, and the position is monitored carefully.
Overview:
Aegon N.V. provides insurance, pensions, and asset management services in the Americas, the Netherlands, and the United Kingdom. The company offers life, accident, and health insurance; savings, pension, annuities, and mutual funds; property and casualty insurance; retirement plans and individual retirement accounts; voluntary employee benefits; and stable value solutions. It also provides debt securities; mortgage loans; derivatives; reinsurance assets; other loans; money market and short-term investments; credit risk management; disability services; and digital banking solutions. Aegon N.V. was founded in 1983 and is headquartered in The Hague, the Netherlands.
(Courtesy: Yahoo Finance)
Sector and Industry Details:
Sector(s): Financial Services
Industry: Insurance—Diversified
Full-time employees: 20,000
Fundamentals:
52-week range 3.5900 - 5.4280
Avg. volume 8,303,512
Market cap 9.599B
PE ratio (TTM) 13.12
EPS (TTM) 0.3600
Ex-dividend date 23 Aug 2022
Current trading price:
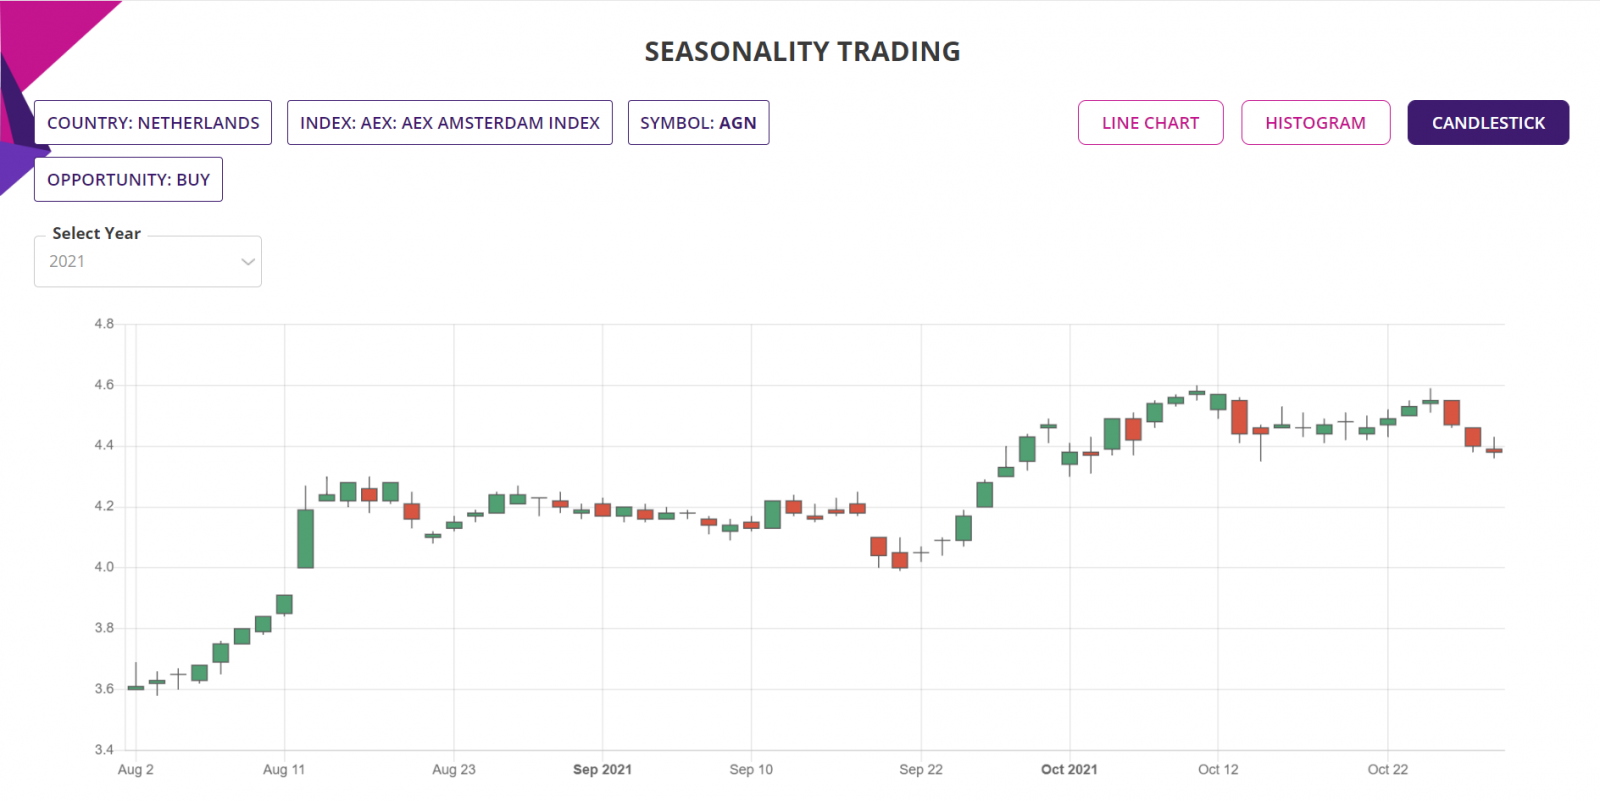
As of Friday, close of 19th August 2022, the stock was trading at 4.7250. All prices are in EUR.
SEASONALITY:
The stock demonstrated strong SEASONAL move in week 34 of the year, here are some of the details of its SEASONAL behaviour:
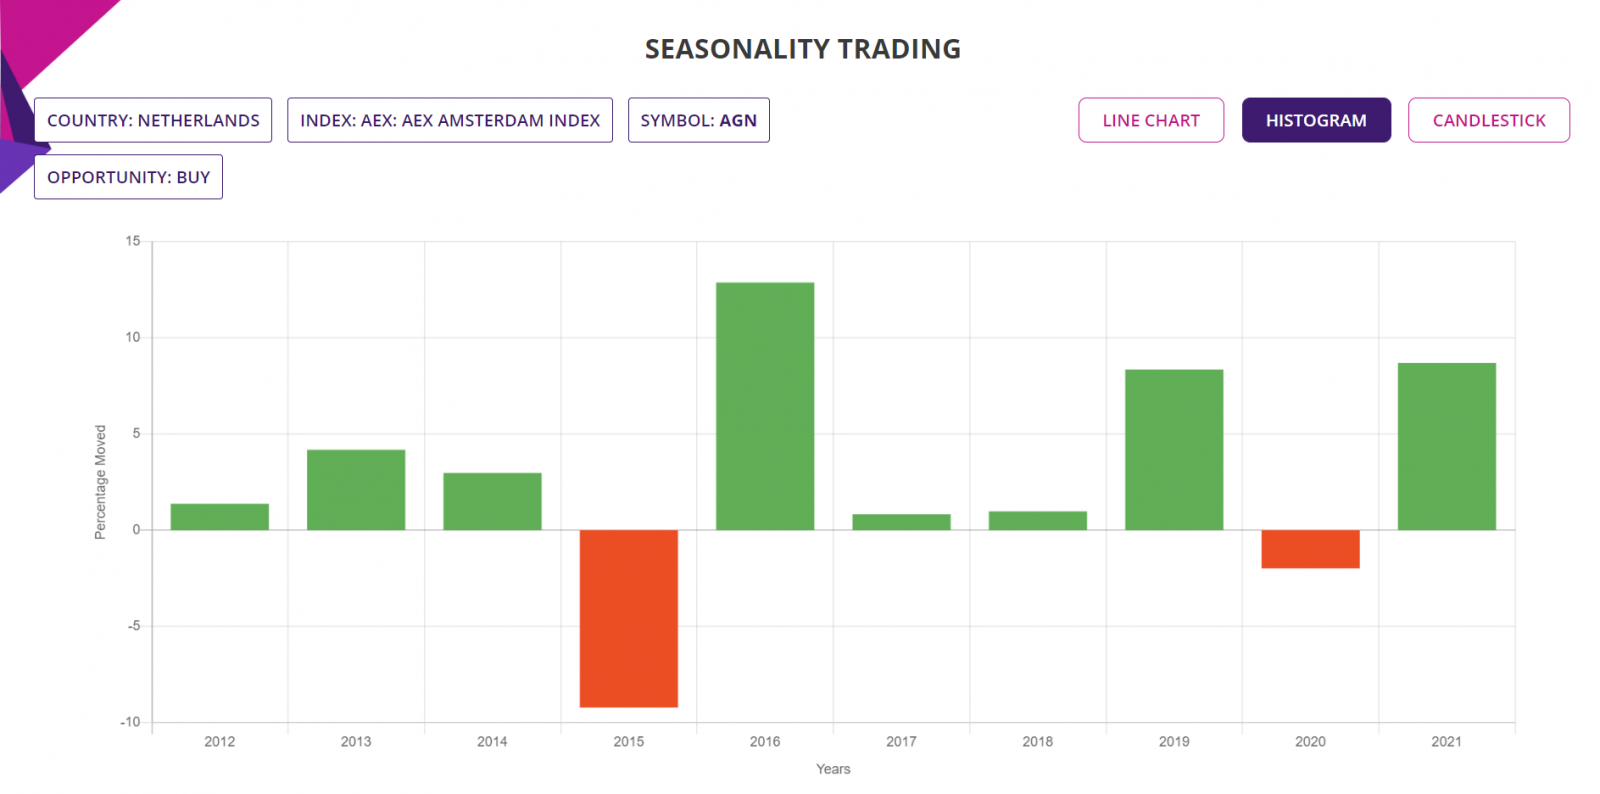
- In 8 out of last 10 years in week 34, the stock was bullish with average move up (AMU) of 7.37% and average move down (AMD) of 7.14% for an average holding time (ADH) of 45 days. Although, the same numbers are far better for Week 35, week 36 and week 37, but because of the AMU to AMD ratio being close to 1, we will put this as WATCH ONLY.
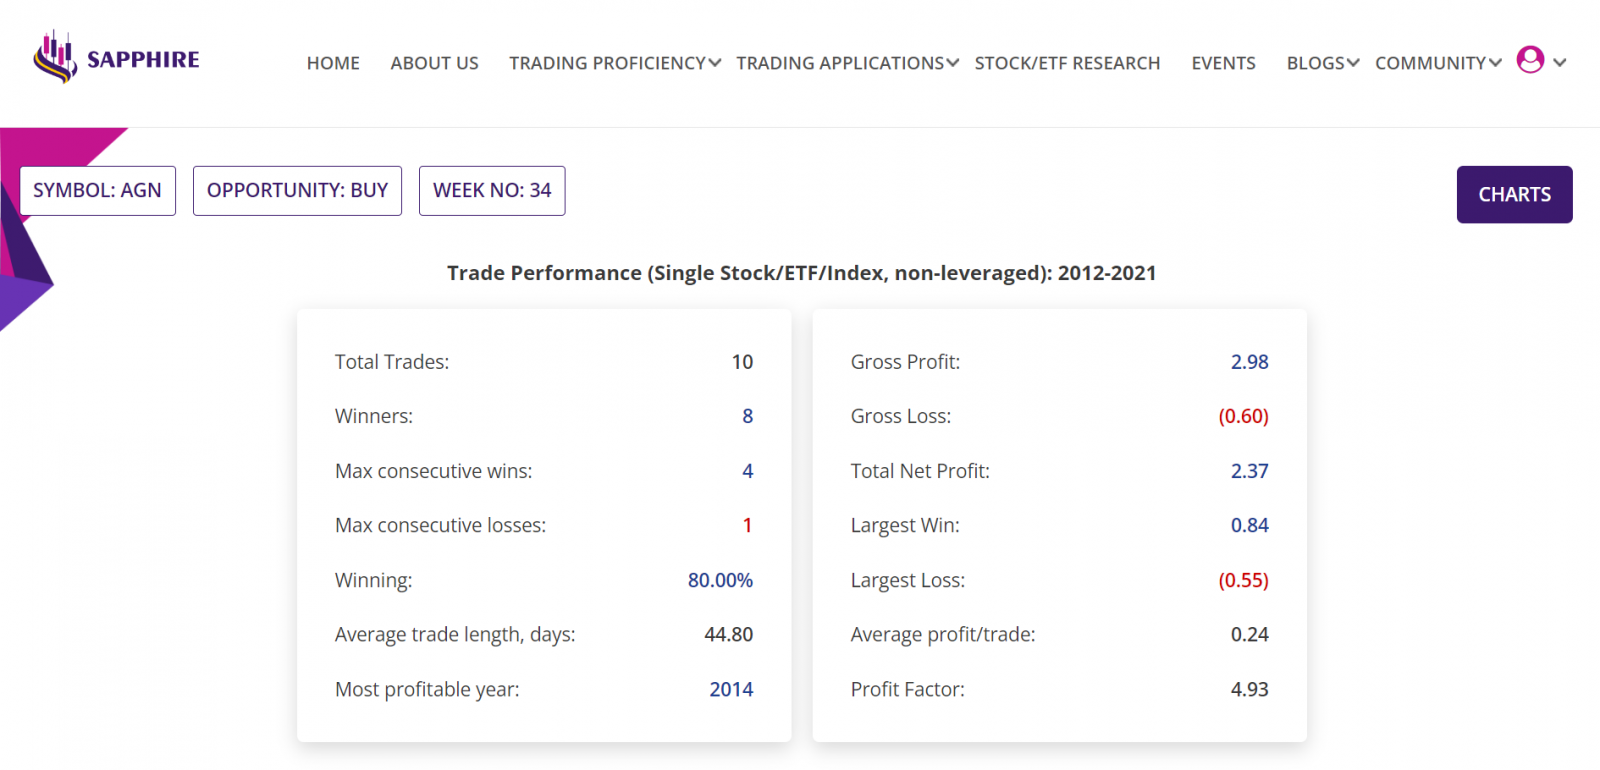
- If 10,000 stocks were bought in the beginning of week 34 every year for last 10 years, then a trader would have had a Gross Profit of EUR29,800, Gross Loss of EUR6000, making a Total Net Profit of EUR23,700. All figures excluding commissions.
- In those 10 years, the Largest Win was EUR8,400, Largest Loss is EUR5500, the Average profit/trade being EUR2400. All figures excluding commissions.
- The average Reward-Risk Ratio (RRR) in those trades were 1:1 and Profit factor being 4.93. As mentioned, this trade is for WATCH only.
Trade Structure:
If we had traded the Stock this week, then we would have structured the trade as follows:
|
TRADE STRUCTURE (All prices in EUR, Euro) |
||
|
Stock price |
4.7250 |
Assuming trade placed at last traded price |
|
Stocks |
10,000 |
Number of Stocks used for this trade |
|
Investment required |
47,250.00 |
Amount of fund required for the trade |
|
Target Stock price (TP) |
4.96 |
5% above the current price |
|
Stop Stock price (SL) |
4.49 |
5% below the current price |
|
Profit Target |
2,362.50 |
Limit order placed at underlying TP price |
|
Stop Loss |
2,362.50 |
Guaranteed stop at SL price |
The choice of RRR of 1:1 is historically consistent with the averages of the 10 trades in each of the last 10 years in Week 34, since 2012 till 2021. As mentioned, we will WATCH this Stock for this example trade, we will monitor the position as we could end up higher than 5% move UP, as has been the case for trades placed in Week 35, Week 36 and Week 37.
Charts:
Summary report extract:
Trade Performance (Single Stock/ETF/Index, non-leveraged): 2012-2021:
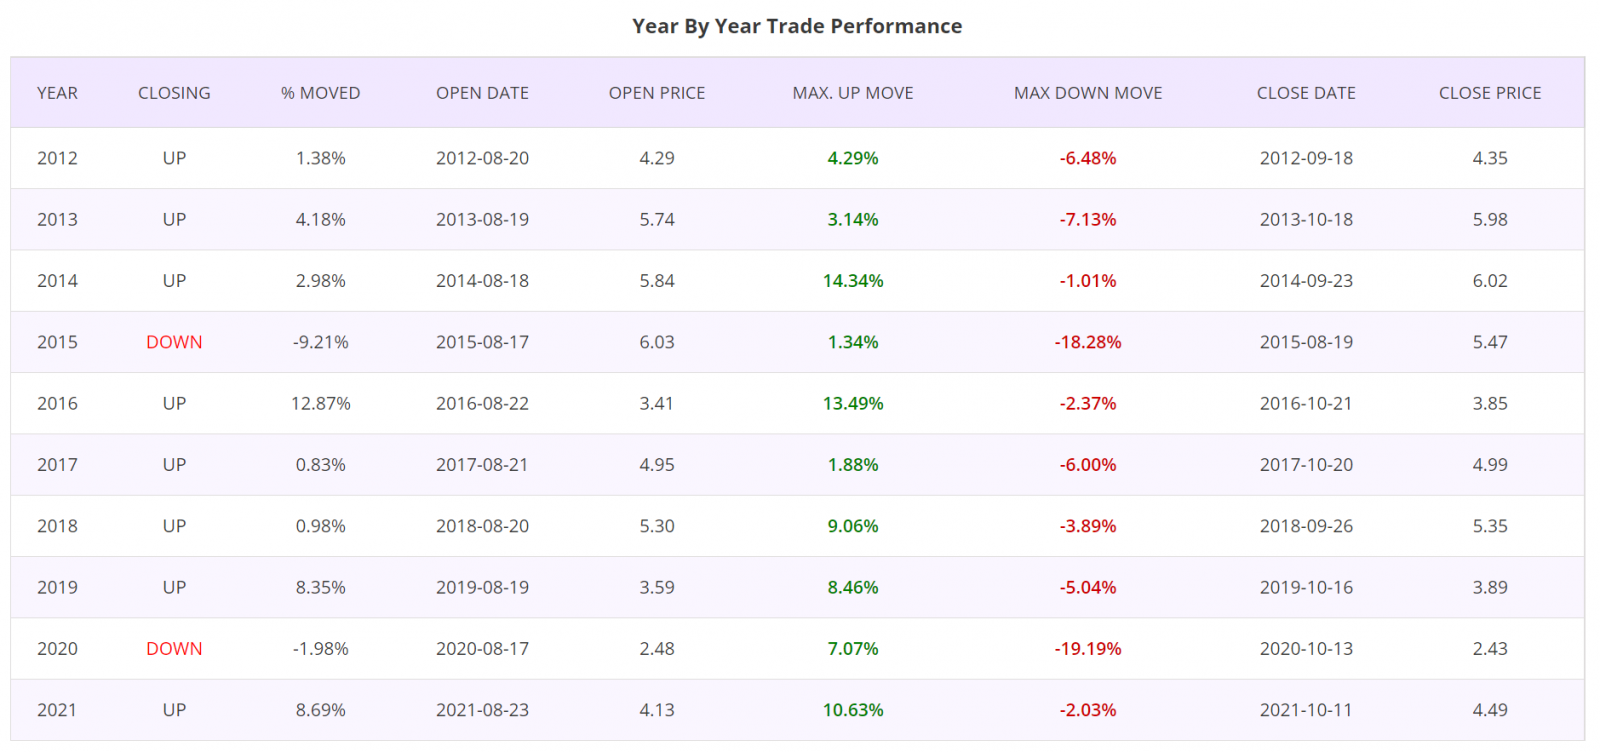
Year by year Trade Performance:
Histogram:
Latest event candlestick chart:
Further Information about trading applications:
Please visit the following URL for more information on various trading applications from Sapphire Capitals which are designed to deliver high probability trading opportunities for swing trading as well as for intraday trading:
https://www.sapphirecapitals.com/pages/swing-trading-stock-seasonality-strategy/
https://www.sapphirecapitals.com/pages/swing-trading-stock-price-action-strategy/
https://www.sapphirecapitals.com/pages/swing-trading-volume-spike-stock-trading-strategy/
https://www.sapphirecapitals.com/pages/day-trading-intraday-seasonality-trading/
Disclaimer:
Sapphire Private Assets (ABN: 34 613 892 023, trading as Sapphire Capitals) is not a broker or a financial adviser but an education and research organisation; we provide training and tools for traders and DIY fund managers for trading in global financial markets. The contents of the blog have been produced by using technical analysis and trading applications developed by Sapphire Capitals for the Stock and ETF traded worldwide. The contents of this blog are intended for education and research purposes only and is not a recommendation or solicitation to invest in any Stock or ETF.
For more details, please visit www.sapphirecapitals.com/Disclaimer.


