
-
 Admin123 :
Admin - Sapphire Capitals
Admin123 :
Admin - Sapphire Capitals -
 Date :
2022-05-21
Date :
2022-05-21
Stock of interest - Week 21 (2022) – AUSTRALIA – SEASONALITY
The week beginning Monday, the 23rd May is Week 21 as per ISO numbering convention of the weeks of a year.
Country in focus:
This week we look at the Stocks from AUSTRALIA in ASX300 index.
Stock/ETF in focus:
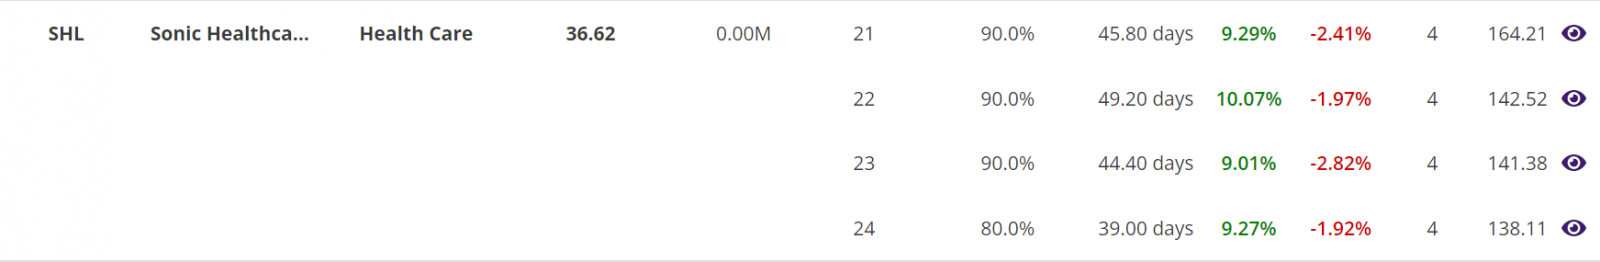
Specific Stock in focus Sonic Healthcare Limited (Ticker: SHL) in the Healthcare Sector and Research & Diagnostics industry.
Trade Direction:
BULLISH, Seasonality study for last 10 years reveal 90.0% probability of success in a BUY (LONG) trade.
Quick note on the Stock: From the Seasonality point of view, Australia is inching towards the flu season with winter approaching. This is the season when need for medicine is on increase for people of all ages. This directly translates into higher revenue for the companies in the healthcare sector, higher profits and corresponding rise in the stock prices of the companies in this sector.
Overview:
Sonic Healthcare Limited offers medical diagnostic services in Australia. The company provides laboratory medicine/pathology; diagnostic imaging/radiology, including magnetic resonance imaging, computed tomography (CT), ultrasound, X-ray, mammography, nuclear medicine, PET CT, interventional procedures, and bone mineral densitometry; and primary care medical services comprising general practice services, occupational health services, remote health services, community and home nursing services, primary care research programs, health assessment technologies, clinical trials, and chronic disease management programs to clinicians, hospitals, community health services, and their patients. It also offers administrative services and facilities to medical practitioners. The company operates in Australia, New Zealand, the United Kingdom, the United States, Germany, Switzerland, Belgium, and Ireland. Sonic Healthcare Limited was incorporated in 1934 and is headquartered in Sydney, Australia.
(Courtesy: Yahoo Finance)
Sector and Industry Details:
Sector(s): Healthcare
Industry: Diagnostics & Research
Full-time employees: 38,000
Fundamentals:
52-week range 32.12 - 46.95
Avg. volume 1,427,657
Market cap 17.509B
PE ratio (TTM) 12.03
EPS (TTM) 3.03
Earnings date 20 Feb 2022
1y target estimate 38.88
Current trading price:
As of Friday, close of 20th May 2022, the stock was trading at 36.47.
SEASONALITY:
The stock demonstrated strong SEASONAL move in week 21 of the year, here are some of the details of its SEASONAL behaviour:
- In 9 out of last 10 years in week 21, the stock was bullish with average move up (AMU) of 9.29% and average move down (AMD) of 2.41% for an average holding time (ADH) of 46 days.
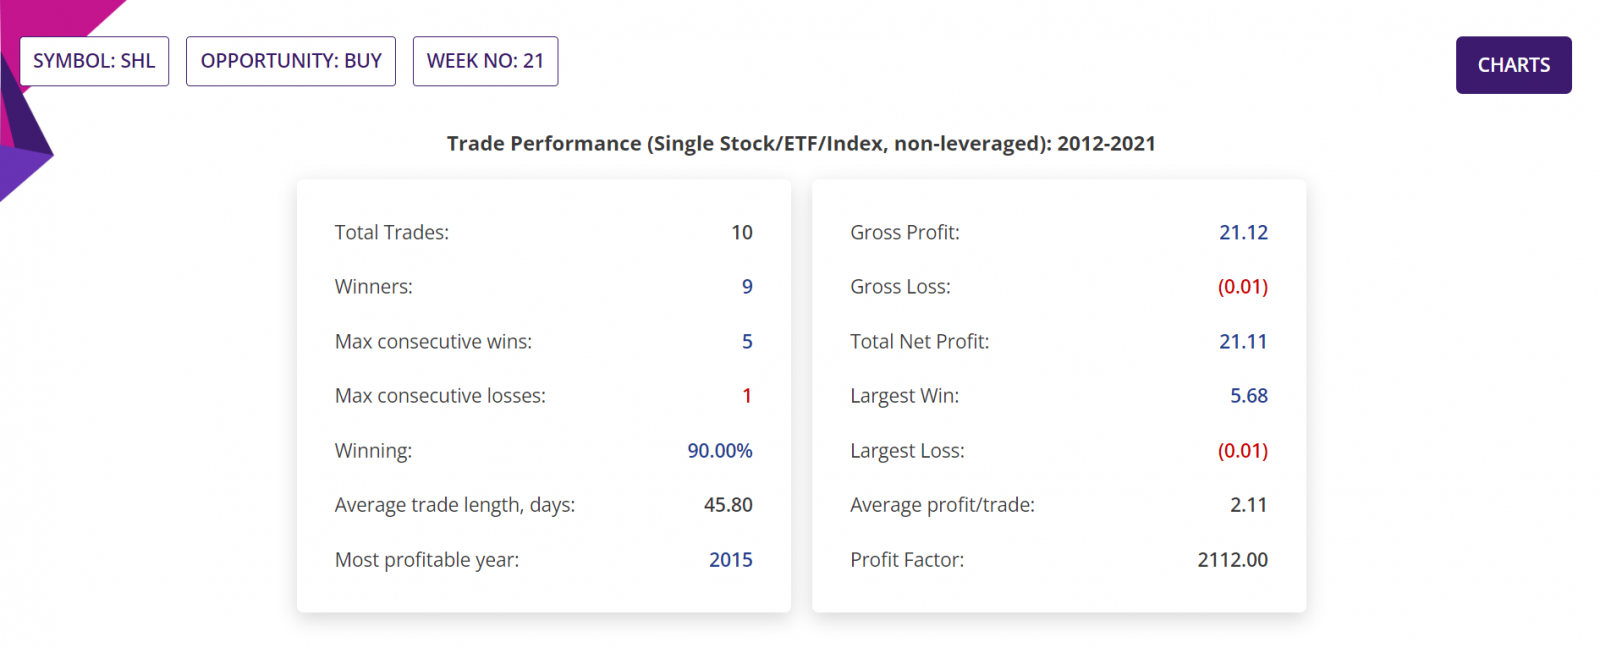
- If 1,000 stocks were bought in the beginning of week 21 every year for last 10 years, then a trader would have had a Gross Profit of $21,120, Gross Loss of $10, making a Total Net Profit of $21,110. All figures excluding commissions.
- In those 10 years, the Largest Win was $5,680, Largest Loss is $10, the Average profit/trade being $2,110. All figures excluding commissions.
- The average Reward-Risk Ratio (RRR) in those trades were over 2000:1.
Trade Structure:
We would trade the Stock as CFD trade, structured as follows with RRR of 3:1:
|
TRADE STRUCTURE |
||
|
Stock price |
$36.47 |
AU$ |
|
CFDs |
300 |
Number of Stocks used for this CFD trade |
|
Leverage |
20 |
CFD leverage |
|
Margin required |
$547.05 |
Amount of fund required for the trade |
|
Target Stock price (TP) |
$41.94 |
15% above the current price |
|
Stop Stock price (SL) |
$35.01 |
4% below the current price |
|
Profit Target |
$1,641.15 |
Limit order placed at underlying price of TP |
|
Stop Loss |
$437.64 |
Guaranteed stop at SL price |
The choice of RRR of 3:1 is historically consistent with the averages following the 29 of the 31 volume spikes since 2018.
Charts:
Summary report extract:
Trade Performance (Single Stock/ETF/Index, non-leveraged): 2012-2021:
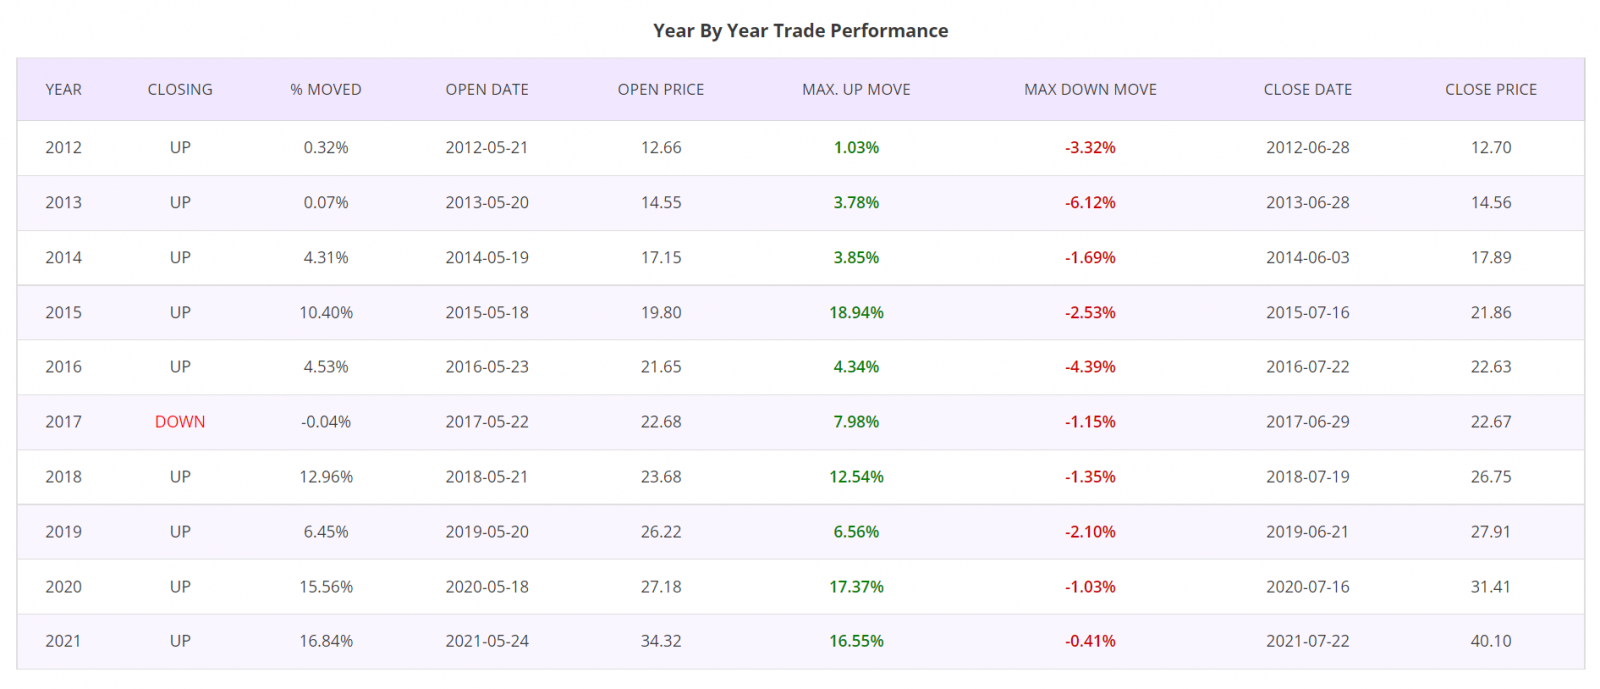
Year by year Trade Performance:
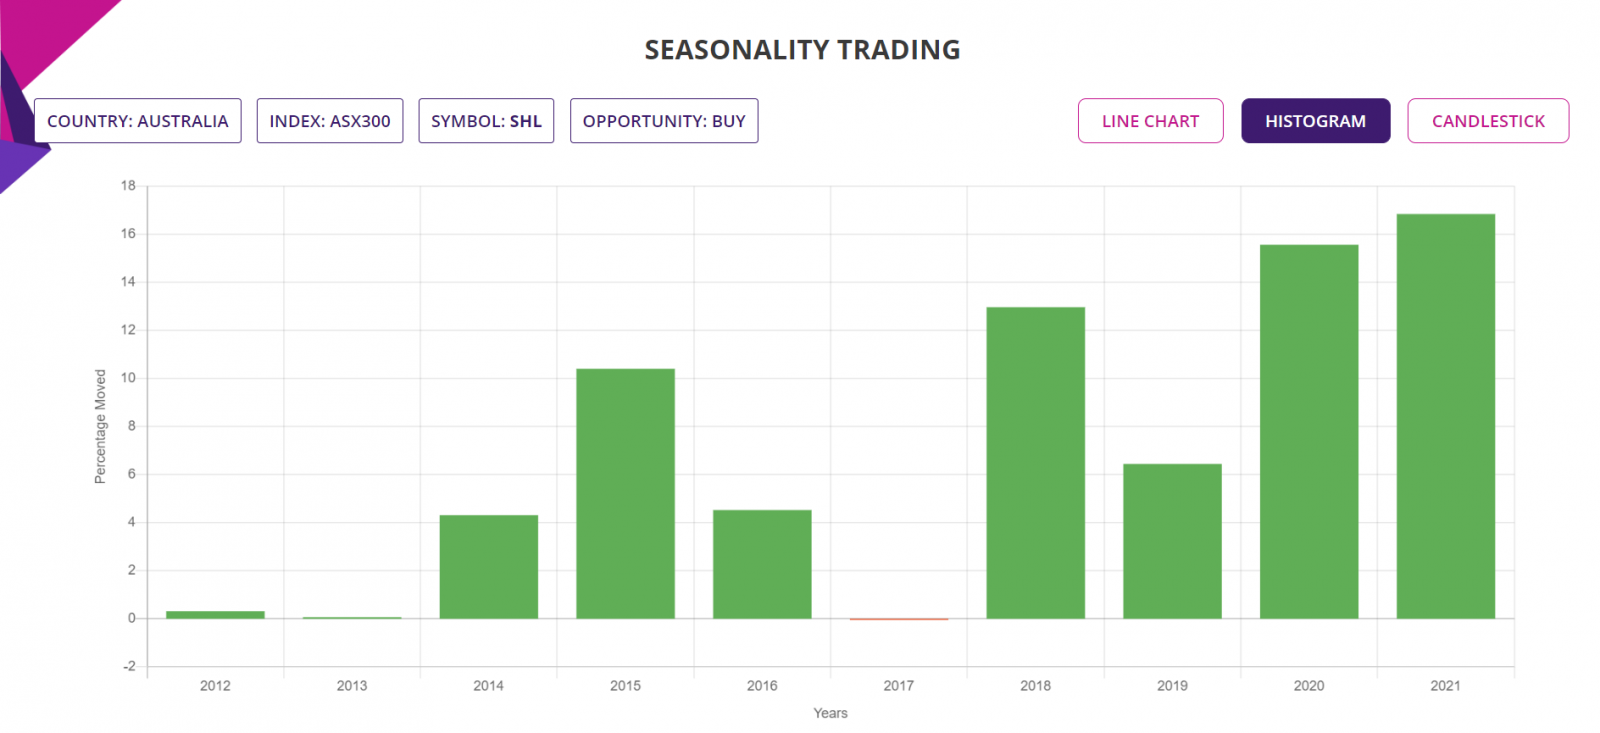
Histogram:
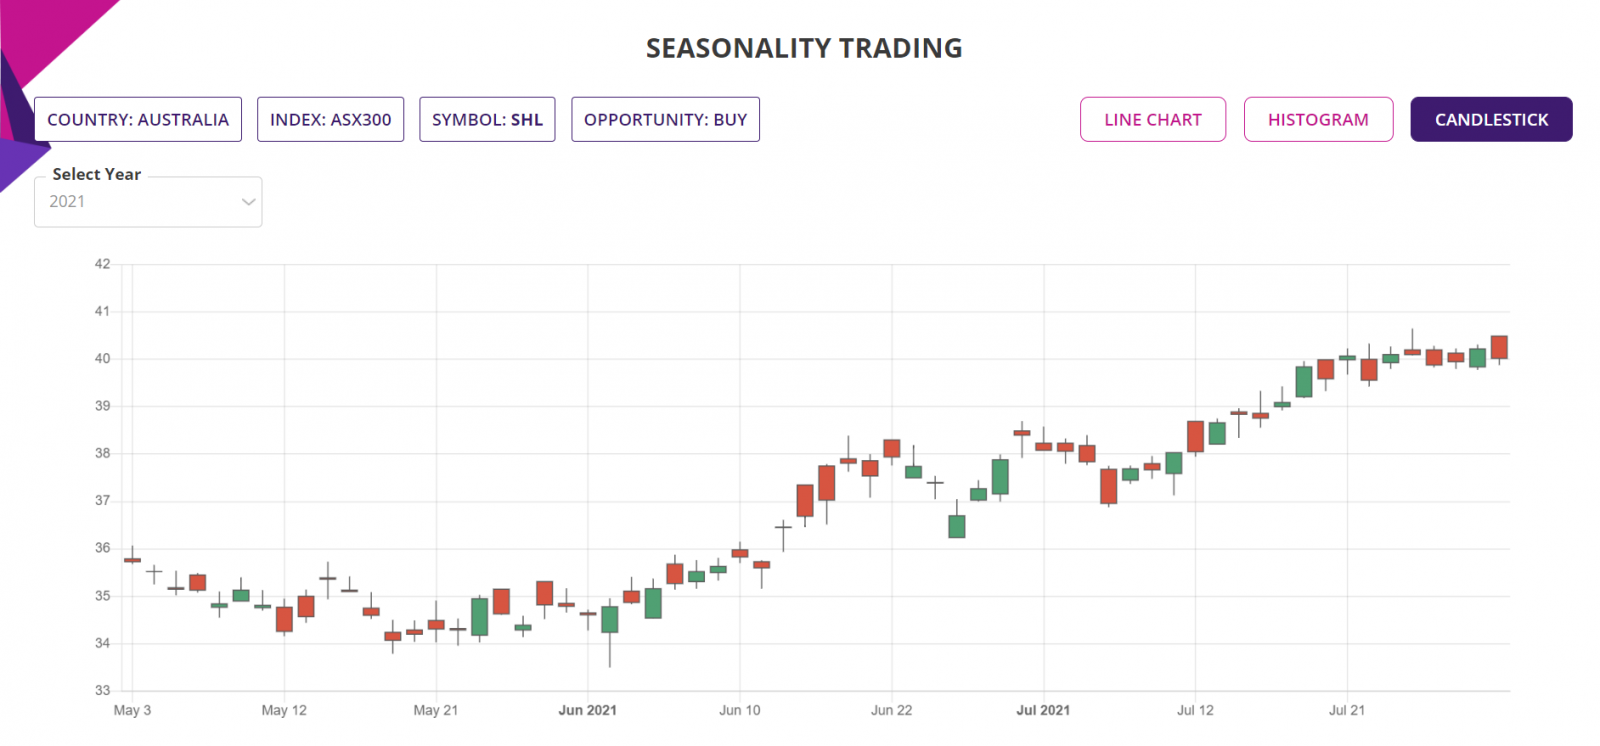
Latest event candlestick chart:
Further Information about trading applications:
Please visit the following URL for more information on various trading applications from Sapphire Capitals which are designed to deliver high probability trading opportunities for swing trading as well as for intraday trading:
https://www.sapphirecapitals.com/pages/swing-trading-stock-seasonality-strategy/
https://www.sapphirecapitals.com/pages/swing-trading-stock-price-action-strategy/
https://www.sapphirecapitals.com/pages/swing-trading-volume-spike-stock-trading-strategy/
https://www.sapphirecapitals.com/pages/day-trading-intraday-seasonality-trading/
Disclaimer:
Sapphire Private Assets (ABN: 34 613 892 023, trading as Sapphire Capitals) is not a broker or a financial adviser but an education and research organisation; we provide training and tools for traders and DIY fund managers for trading in global financial markets. The contents of the blog have been produced by using technical analysis and trading applications developed by Sapphire Capitals for the Stock and ETF traded worldwide. The contents of this blog are intended for education and research purposes only and is not a recommendation or solicitation to invest in any Stock or ETF.
For more details, please visit www.sapphirecapitals.com/Disclaimer.


